| 2022 Investor Day December 15, 2022 |

| 2 2 Disclosure Regarding Forward - Looking Statements Throughout this presentation, we make a number of “forward - looking statements,” including statements regarding the proposed sale of our Batesville business (the “Proposed Transaction”) and the expected timing, costs and benefits thereof, that are within the meaning of Section 27A of the Securities Act of 1933, as amended, Section 21E of the Securities Exchange Act o f 1 934, as amended, and the Private Securities Litigation Reform Act of 1995, and that are intended to be covered by the safe harbor provided under these sections. As the words imply, these are statements about future sales, earnings, cash fl ow, results of operations, uses of cash, financings, share repurchases, ability to meet deleveraging goals, and other measures of financial performance or potential future plans or events, strategies, objectives, beliefs, prospects, assumption s, expectations, projected costs or savings or transactions of Hillenbrand (the “Company”) that might or might not happen in the future, the anticipated costs and benefits of the Proposed Transaction, and the expected timing of completion of the Prop ose d Transaction, as contrasted with historical information. Forward - looking statements are based on assumptions that we believe are reasonable, but by their very nature are subject to a wide range of risks. If our assumptions prove inaccurate or unknown risks and uncertainties materialize, actual results could vary materially from Hillenbrand’s expectations and projections. Words that could indicate that we are making forward - looking statements include the following: intend believe plan expect may goal would project position become pursue estimate will forecast continue could anticipate remain target encourage promise improve progress potential should impact This is not an exhaustive list, but is intended to give you an idea of how we try to identify forward - looking statements. The ab sence of any of these words, however, does not mean that the statement is not forward - looking. Here is the key point: Forward - looking statements are not guarantees of future performance or events, and actual results or events could differ materia lly from those set forth in any forward - looking statements. Any number of factors, many of which are beyond our control, could cause our performance to differ significantly from what is described in the forward - looking statem ents. These factors include, but are not limited to: global market and economic conditions, including those related to the financial markets; the impact of contagious diseases such as the COVID - 19 pandemic and the escalation thereof due to variant str ains of the virus and the societal, governmental, and individual responses thereto, including supply chain disruption, loss of contracts and/or customers, erosion of some customers’ credit quality, downgrades of the Company’s credit quality, cl osu re or temporary interruption of the Company’s or its suppliers’ manufacturing facilities, travel, shipping and logistical disruptions, domestic and international general economic conditions, such as inflation, exchange rates and interest rates, lo ss of human capital or personnel, and general economic calamities; risks related to the Russian Federation’s invasion of Ukraine (referred to herein as the “Ukraine War”) and resulting geopolitical instability and uncertainty, which could have a neg ative impact on our ability to sell to, ship products to, collect payments from, and support customers in certain regions, in addition to the potential effect of supply chain disruptions that could adversely affect profitability; the risk of business dis ruptions associated with information technology, cyber - attacks, or catastrophic losses affecting infrastructure; negative effect s of the Linxis Group SAS (“ Linxis ”) acquisition or other acquisitions on the Company’s business, financial condition, results of operations and financial perf orm ance (including the ability of the Company to maintain relationships with its customers, suppliers and others with whom it does business); the possibility that the anticipated benefits from the Linxis acquisition and other acquisitions cannot be realized by the Company in full or at all or may take longer to realize than exp ec ted; risks that the integrations of Linxis or other acquired businesses disrupt current operations or pose potential difficulties in employee retention or otherwise aff ec ts financial or operating results; any failure to obtain, or delays in obtaining, required regulatory approvals or clearances for the Proposed Transaction; any failure by the parties to satisfy any of the other conditions to th e P roposed Transaction; the possibility that the Proposed Transaction is ultimately not consummated; potential adverse effects of the announcement or results of the Proposed Transaction on the market price of the Company’s common stock or on the abilit y o f the Company to develop and maintain relationships with its personnel and customers, suppliers and others with whom it does business or otherwise on the Company’s business, financial condition, results of operations and financial perfor man ce; risks related to diversion of management’s attention from our ongoing business operations due to the Proposed Transaction; the impact of the Proposed Transaction on the ability of the Company to retain and hire key personnel; increasin g c ompetition for highly skilled and talented workers as well as labor shortages; our level of international sales and operations; the impact of incurring significant amounts of indebtedness and any inability of the Company to respond to change s i n its business or make future desirable acquisitions; the ability of the Company to comply with financial or other covenants in debt agreements; cyclical demand for industrial capital goods; the ability to recognize the benefits of any acqu isi tion or disposition, including potential synergies and cost savings or the failure of the Company or any acquired company to achieve its plans and objectives generally; impairment charges to goodwill and other identifiable intangible assets; competit ion in the industries in which we operate, including on price; impacts of decreases in demand or changes in technological advances, laws, or regulation on the revenues that we derive from the plastics industry; our reliance upon employees, agents, an d business partners to comply with laws in many countries and jurisdictions; increased costs, poor quality, or unavailability of raw materials or certain outsourced services and supply chain disruptions; continued fluctuations in mortal ity rates and increased cremations; the dependence of our business units on relationships with several large customers and providers; competition faced by our Batesville business from non - traditional sources; the impact to the Company’s effective tax rate of changes in the mix of earnings or tax laws and certain other tax - related matters; exposure to tax uncertainties and audits; involvement in claims, lawsuits and governmental proceedings related to operations; uncertainty in the United States pol itical and regulatory environment or global trade policy; adverse foreign currency fluctuations; labor disruptions; and the effect of certain provisions of the Company’s governing documents and Indiana law that could decrease the trading price of th e C ompany’s common stock. There can be no assurance that the Proposed Transaction will be consummated. Shareholders, potential investors, and other readers are urged to consider these risks and uncertainties in evaluating forwar d - l ooking statements and are cautioned not to place undue reliance on the forward - looking statements. For a more in - depth discussion of these and other factors that could cause actual results to differ from those contained in forward - looking statemen ts, see the discussion under the heading “Risk Factors” in Part I, Item 1A of Hillenbrand’s Form 10 - K for the year ended September 30, 2022, filed with the Securities and Exchange Commission (“SEC”) on November 16, 2022. The forward - looking informat ion in this presentation speaks only as of the date hereof, and we assume no obligation to update or revise any forward - looking information. 2 |
| Q&A Reminder 3 |

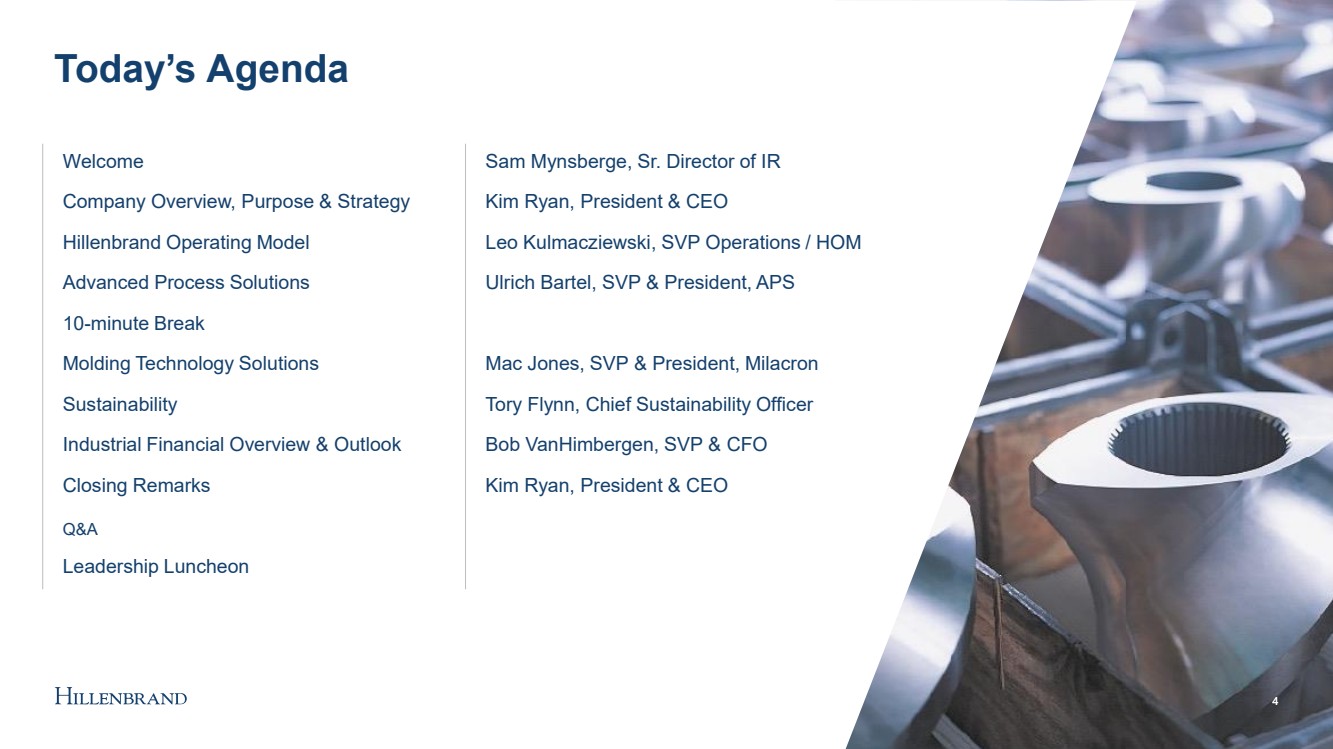
| 4 4 Today’s Agenda Welcome Sam Mynsberge, Sr. Director of IR Company Overview, Purpose & Strategy Kim Ryan, President & CEO Hillenbrand Operating Model Leo Kulmacziewski , SVP Operations / HOM Advanced Process Solutions Ulrich Bartel, SVP & President, APS 10 - minute Break Molding Technology Solutions Mac Jones, SVP & President, Milacron Sustainability Tory Flynn, Chief Sustainability Officer Industrial Financial Overview & Outlook Bob VanHimbergen, SVP & CFO Closing Remarks Kim Ryan, President & CEO Q&A Leadership Luncheon |
| Company Overview, Vision, & Strategy Kim Ryan – President & Chief Executive Officer 5 |
| Hillenbrand: A Compelling Investment 6 6 Transformed into a pure - play global industrial leader in highly - engineered, mission - critical processing solutions serving customers throughout the product lifecycle Embedded purpose throughout our organization to drive our commitment to support a more sustainable future for all stakeholders Well positioned for long - term growth in attractive end markets aligned with secular growth trends Proven track record of performance enabled by the Hillenbrand Operating Model Focused on maximizing shareholder value through our disciplined capital allocation framework |
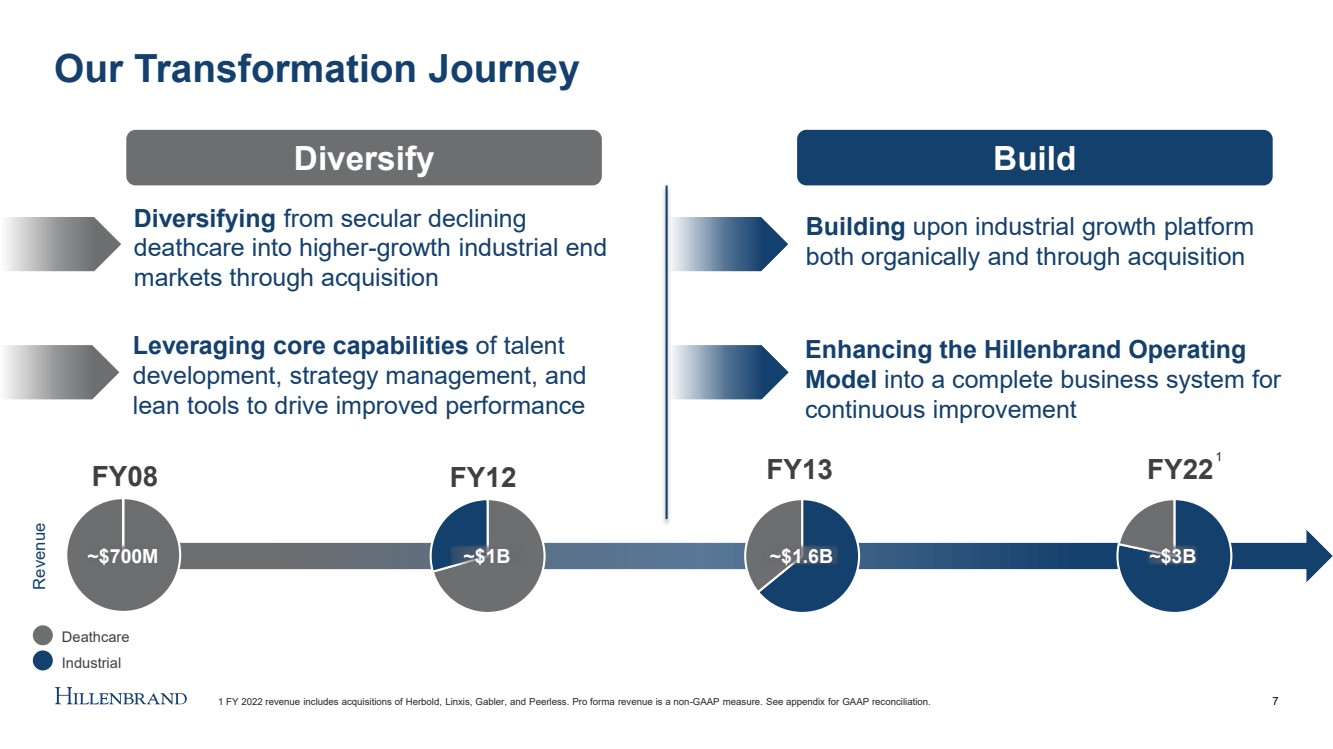
| Diversify Our Transformation Journey 7 Deathcare Deathcare Industrial Industrial Deathcare FY08 FY12 FY13 FY22 Industrial Deathcare Diversifying from secular declining deathcare into higher - growth industrial end markets through acquisition Leveraging core capabilities of talent development, strategy management, and lean tools to drive improved performance Building upon industrial growth platform both organically and through acquisition Enhancing the Hillenbrand Operating Model into a complete business system for continuous improvement ~$700M ~$1B ~$1.6B ~$3B Build Revenue 1 FY 2022 revenue includes acquisitions of Herbold, Linxis , Gabler, and Peerless. Pro forma revenue is a non - GAAP measure. See appendix for GAAP reconciliation. 1 Deathcare Industrial |
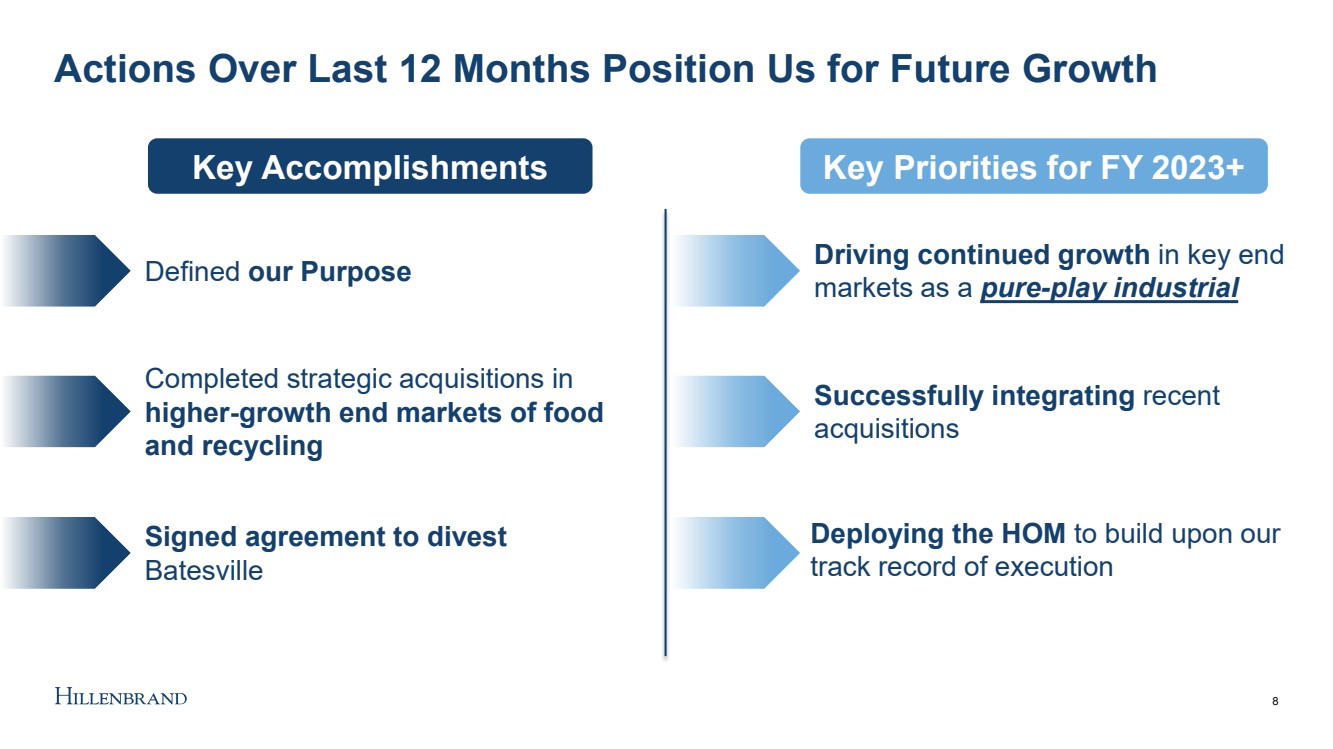
| Actions Over Last 12 Months Position Us for Future Growth 8 Driving continued growth in key end markets as a pure - play industrial Defined our Purpose Completed strategic acquisitions in higher - growth end markets of food and recycling Signed agreement to divest Batesville Deploying the HOM to build upon our track record of execution Successfully integrating recent acquisitions Key Accomplishments Key Priorities for FY 2023+ |
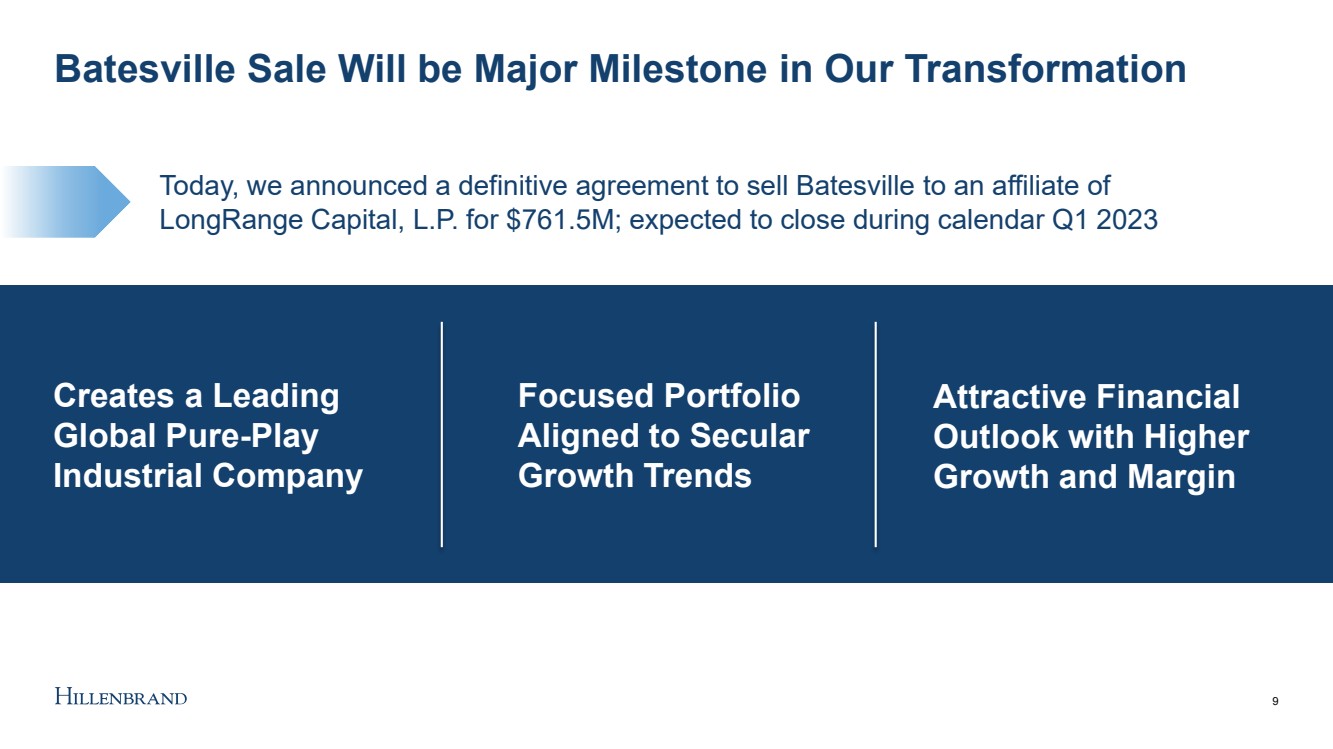
| Batesville Sale Will be Major Milestone in Our Transformation 9 Today, we announced a definitive agreement to sell Batesville to an affiliate of LongRange Capital, L.P. for $761.5M ; expected to close during calendar Q1 2023 Creates a Leading Global Pure - Play Industrial Company Focused Portfolio Aligned to Secular Growth Trends Attractive Financial Outlook with Higher Growth and Margin |
| 10 Purpose Video Placeholder |

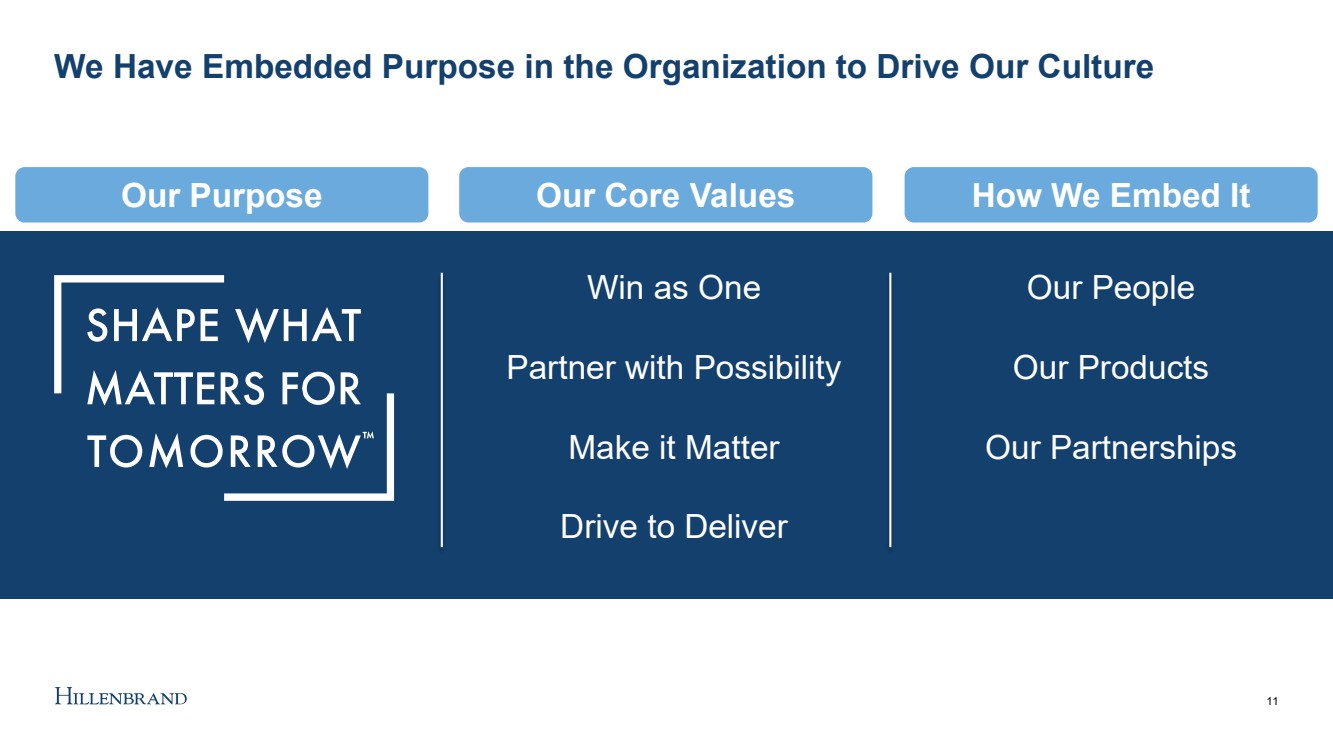
| We Have Embedded Purpose in the Organization to Drive Our Culture 11 Win as One Partner with Possibility Make it Matter Drive to Deliver Our People Our Products Our Partnerships Our Purpose Our Core Values How We Embed It |
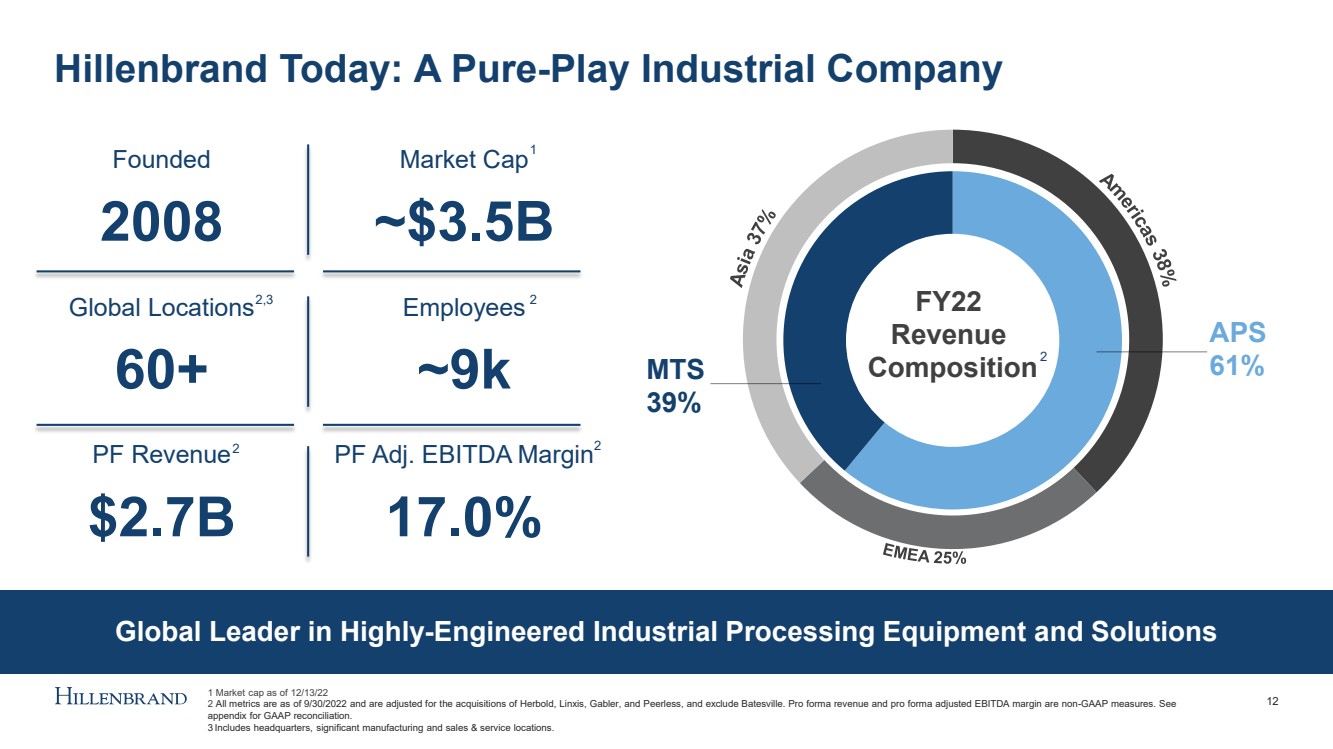
| 40 % FY22 Revenue Composition Hillenbrand Today: A Pure - Play Industrial Company 12 Founded 2008 Market Cap ~$3.5B Global Locations 60+ Employees ~9k PF Revenue $2.7B PF Adj. EBITDA Margin 17.0% MTS 39% APS 61% Global Leader in Highly - Engineered Industrial Processing Equipment and Solutions 1 Market cap as of 12/13/22 2 All metrics are as of 9/30/2022 and are adjusted for the acquisitions of Herbold, Linxis , Gabler, and Peerless, and exclude Batesville. Pro forma revenue and pro forma adjusted EBITDA margin are non - GAAP measures. Se e appendix for GAAP reconciliation. 3 Includes headquarters, significant manufacturing and sales & service locations. 2,3 2 2 2 1 2 |
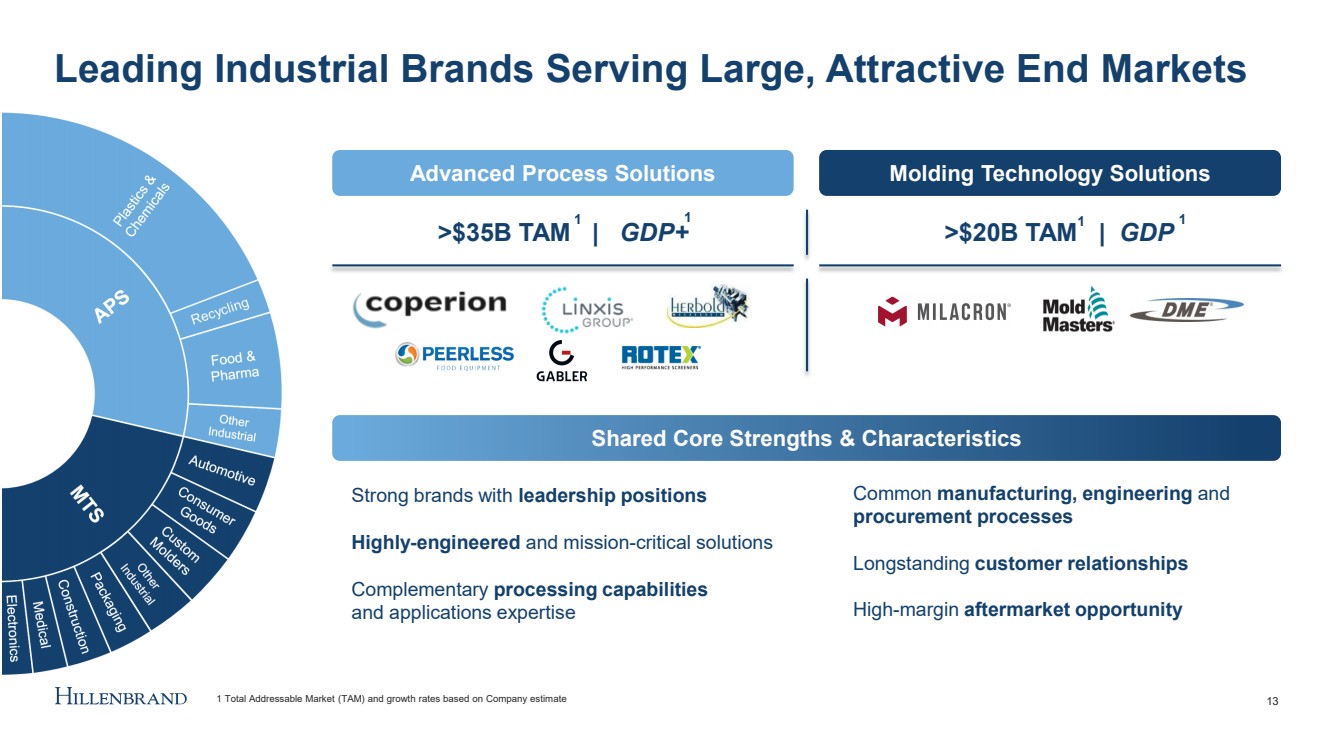
| >$35B TAM | GDP+ >$20B TAM | GDP Advanced Process Solutions Leading Industrial Brands Serving Large, Attractive End Markets 13 Molding Technology Solutions Shared Core Strengths & Characteristics 1 Total Addressable Market (TAM) and growth rates based on Company estimate 1 1 Common manufacturing, engineering and procurement processes Longstanding customer relationships High - margin aftermarket opportunity Strong brands with leadership positions Highly - engineered and mission - critical solutions Complementary processing capabilities and applications expertise 1 1 |
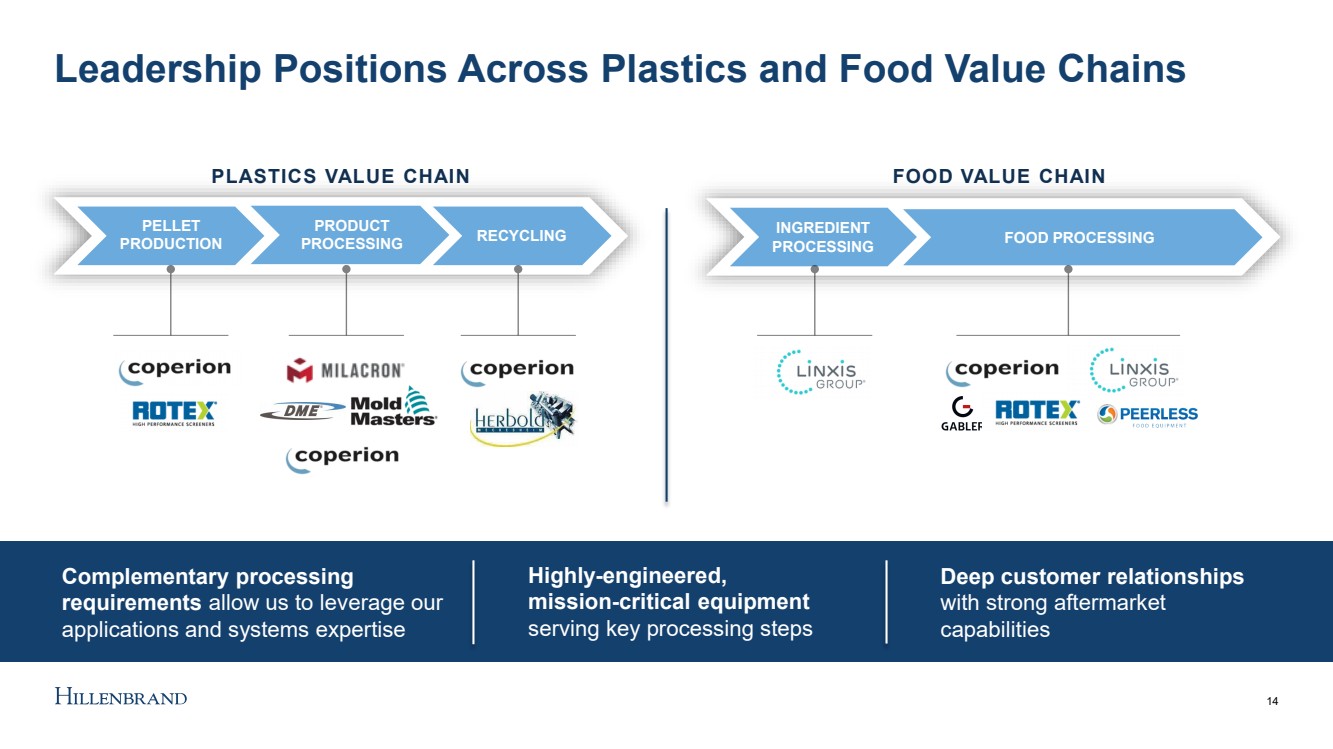
| 14 Leadership Positions Across Plastics and Food Value Chains Highly - engineered, mission - critical equipment serving key processing steps Deep customer relationships with strong aftermarket capabilities Complementary processing requirements allow us to leverage our applications and systems expertise PLASTICS VALUE CHAIN PELLET PRODUCTION PRODUCT PROCESSING RECYCLING FOOD VALUE CHAIN INGREDIENT PROCESSING FOOD PROCESSING |
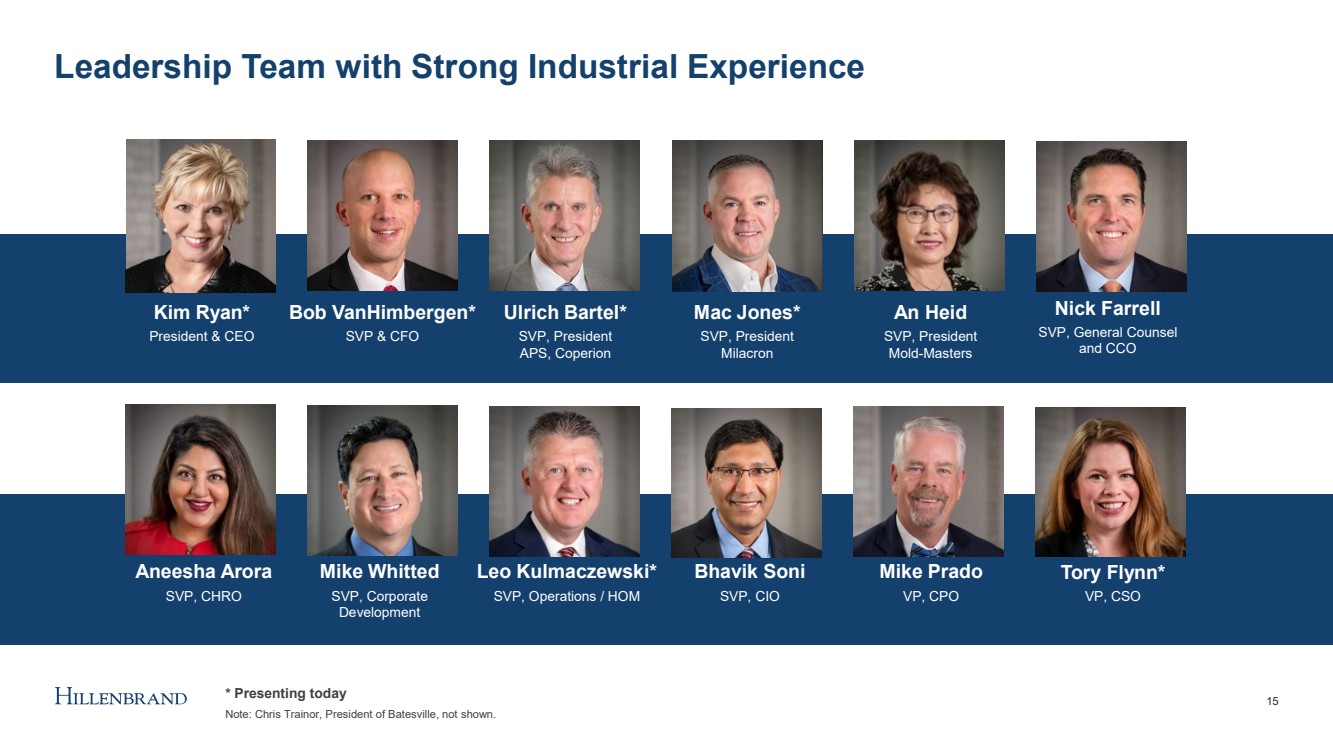
| Leadership Team with Strong Industrial Experience 15 Kim Ryan* President & CEO Bob VanHimbergen* SVP & CFO Mike Whitted SVP, Corporate Development Bhavik Soni SVP, CIO Leo Kulmaczewski* SVP, Operations / HOM Ulrich Bartel* SVP, President APS, Coperion Mac Jones* SVP, President Milacron Aneesha Arora SVP, CHRO Tory Flynn* VP, CSO Mike Prado VP, CPO * Presenting today Note: Chris Trainor, President of Batesville, not shown. An Heid SVP, President Mold - Masters Nick Farrell SVP, General Counsel and CCO |
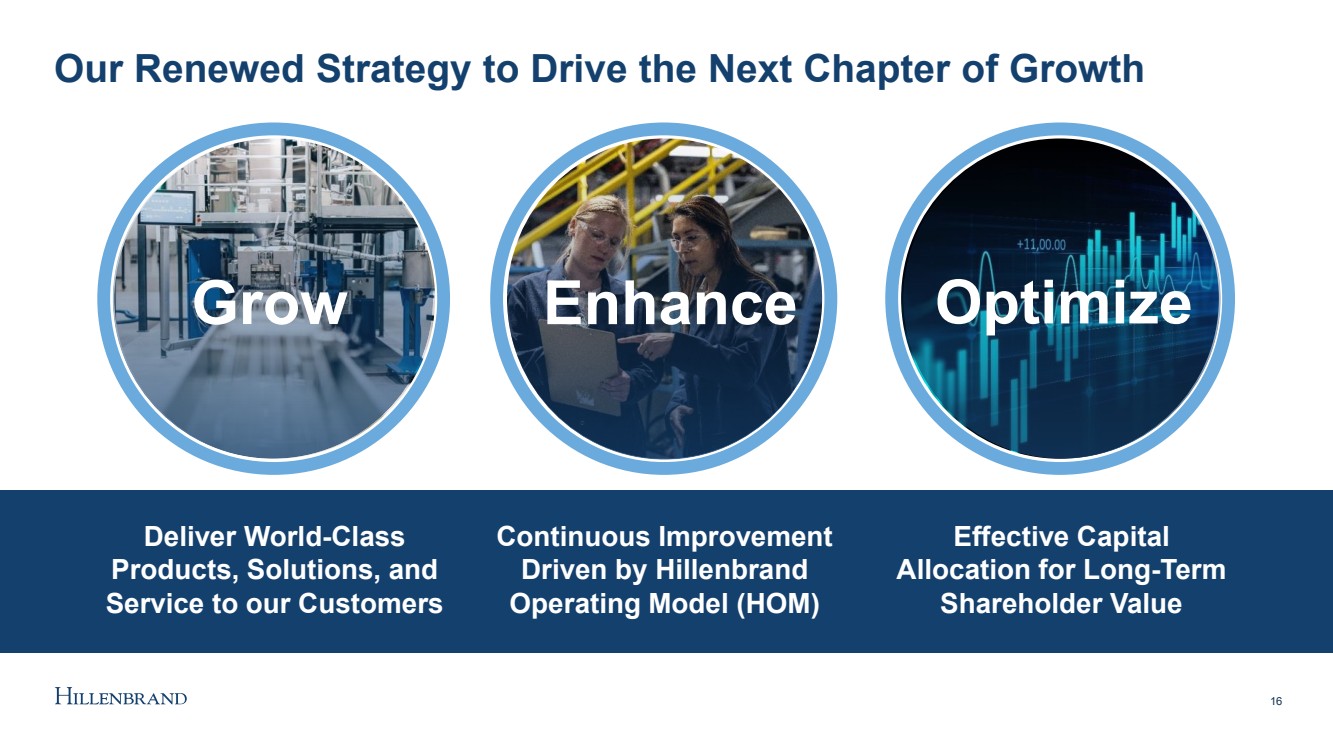
| Our Renewed Strategy to Drive the Next Chapter of Growth Deliver World - Class Products, Solutions, and Service to our Customers Enhance Optimize Continuous Improvement Driven by Hillenbrand Operating Model (HOM) Effective Capital Allocation for Long - Term Shareholder Value 16 Grow |
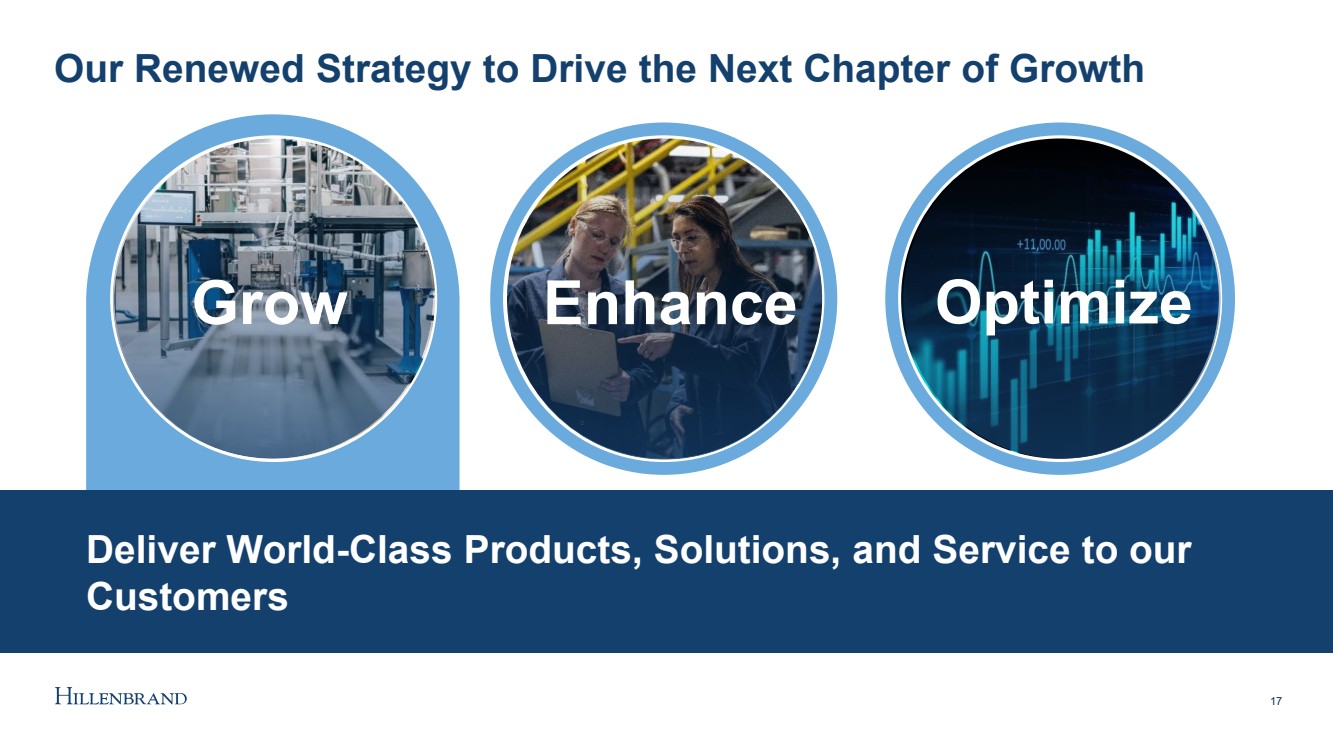
| Our Renewed Strategy to Drive the Next Chapter of Growth Deliver World - Class Products, Solutions, and Service to our Customers Enhance Optimize 17 Grow |
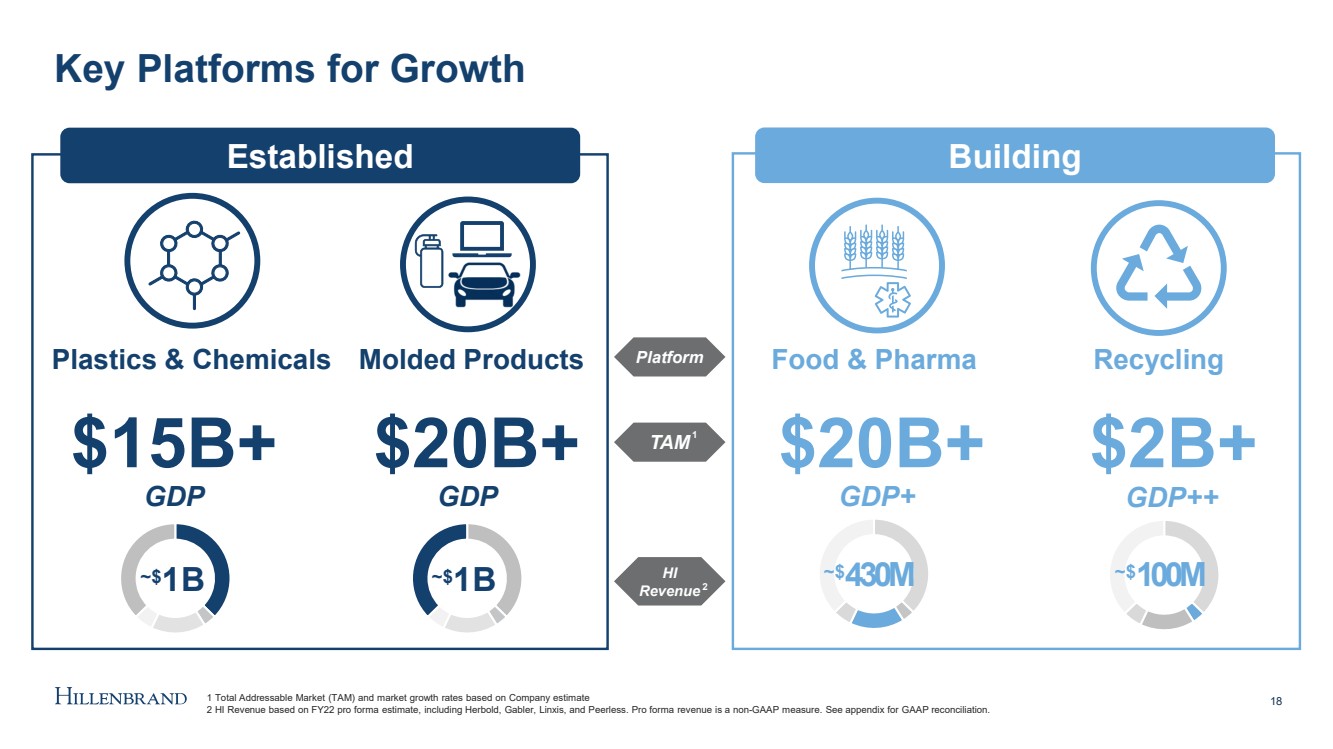
| Platform TAM HI Revenue Key Platforms for Growth 18 Established Building Food & Pharma Recycling Molded Products Plastics & Chemicals $15B+ $20B+ $20B+ $2B+ GDP GDP GDP+ GDP++ ~$ 1 B ~$ 1 B ~$ 430M ~$ 100M 1 2 1 Total Addressable Market (TAM) and market growth rates based on Company estimate 2 HI Revenue based on FY22 pro forma estimate, including Herbold, Gabler, Linxis , and Peerless. Pro forma revenue is a non - GAAP measure. See appendix for GAAP reconciliation. |
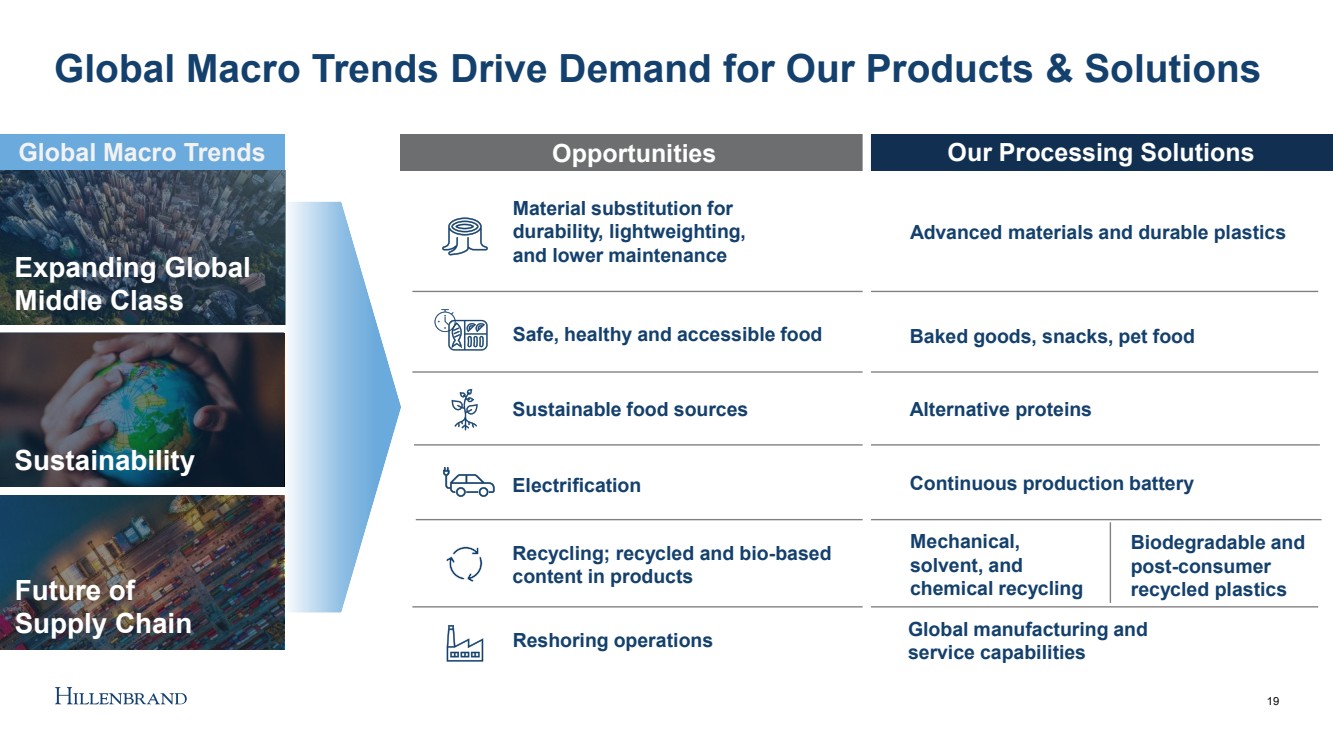
| Global Macro Trends Drive Demand for Our Products & Solutions 19 Global Macro Trends Expanding Global Middle Class 19 Sustainability Future of Supply Chain Advanced materials and durable plastics Material substitution for durability, lightweighting , and lower maintenance Opportunities Our Processing Solutions Electrification Continuous production battery Safe, healthy and accessible food Baked goods, snacks, pet food Sustainable food sources Alternative proteins Reshoring operations Global manufacturing and service capabilities Mechanical, solvent, and chemical recycling Biodegradable and post - consumer recycled plastics Recycling; recycled and bio - based content in products |
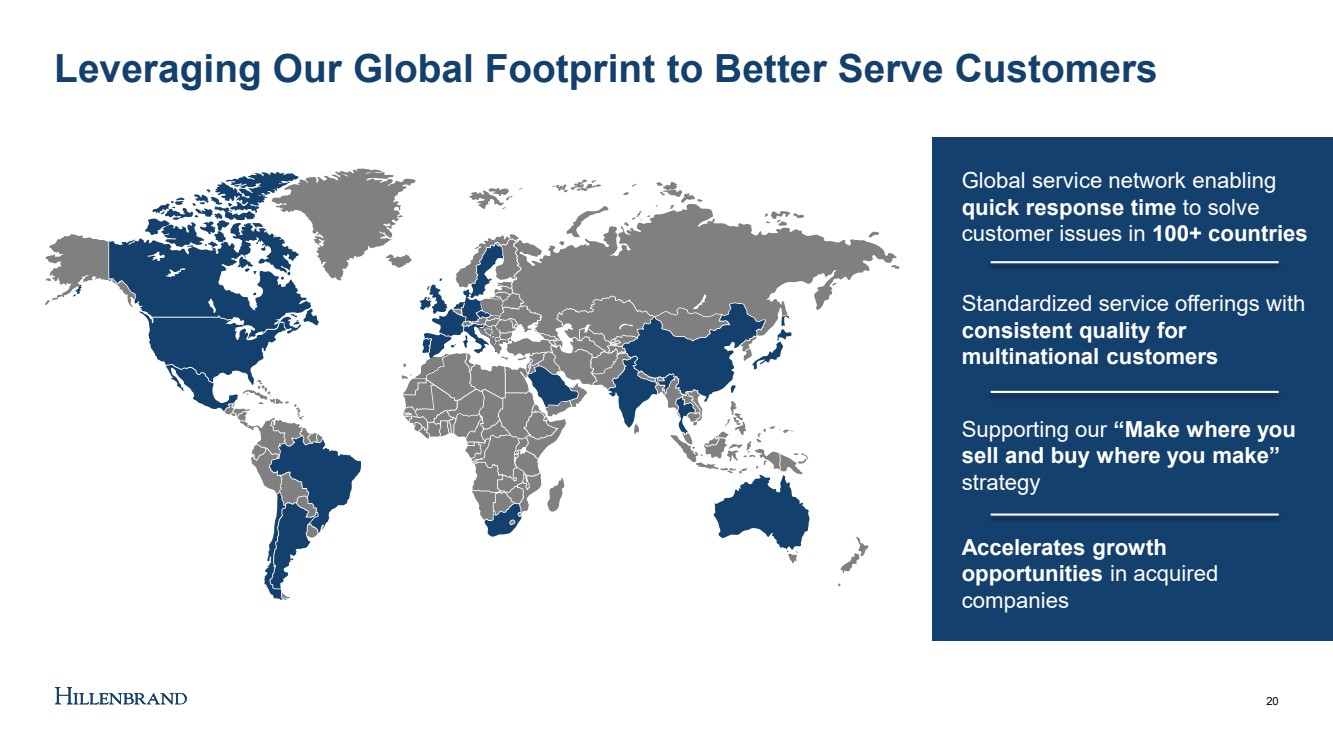
| Leveraging Our Global Footprint to Better Serve Customers 20 Global service network enabling quick response time to solve customer issues in 100+ countries Standardized service offerings with consistent quality for multinational customers Supporting our “Make where you sell and buy where you make” strategy Accelerates growth opportunities in acquired companies |
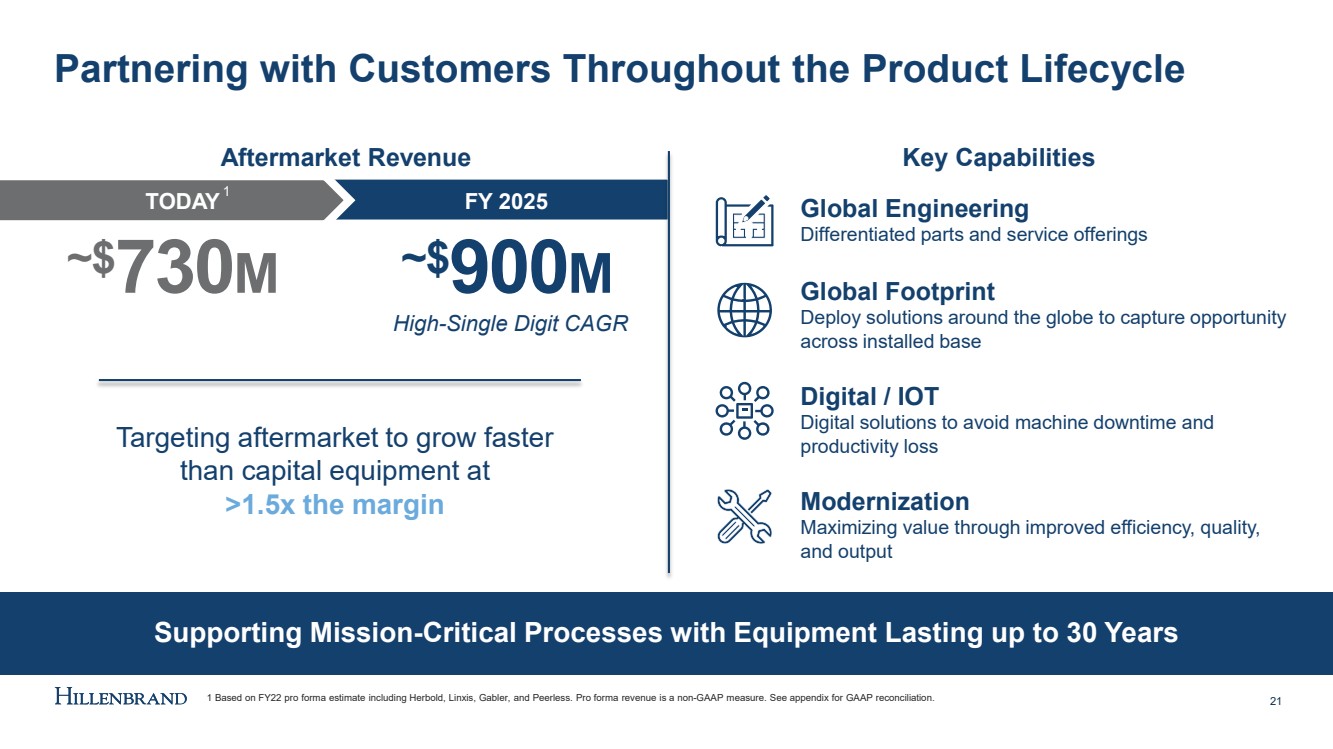
| Supporting Mission - Critical Processes with Equipment Lasting up to 30 Years Partnering with Customers Throughout the Product Lifecycle Key Capabilities Global Engineering Differentiated parts and service offerings Global Footprint Deploy solutions around the globe to capture opportunity across installed base Digital / IOT Digital solutions to avoid machine downtime and productivity loss Modernization Maximizing value through improved efficiency, quality, and output Aftermarket Revenue 21 TODAY FY 2025 ~$ 900 M ~$ 730 M High - Single Digit CAGR Targeting aftermarket to grow faster than capital equipment at >1.5x the margin 1 Based on FY22 pro forma estimate including Herbold, Linxis , Gabler, and Peerless. Pro forma revenue is a non - GAAP measure. See appendix for GAAP reconciliation. 1 |
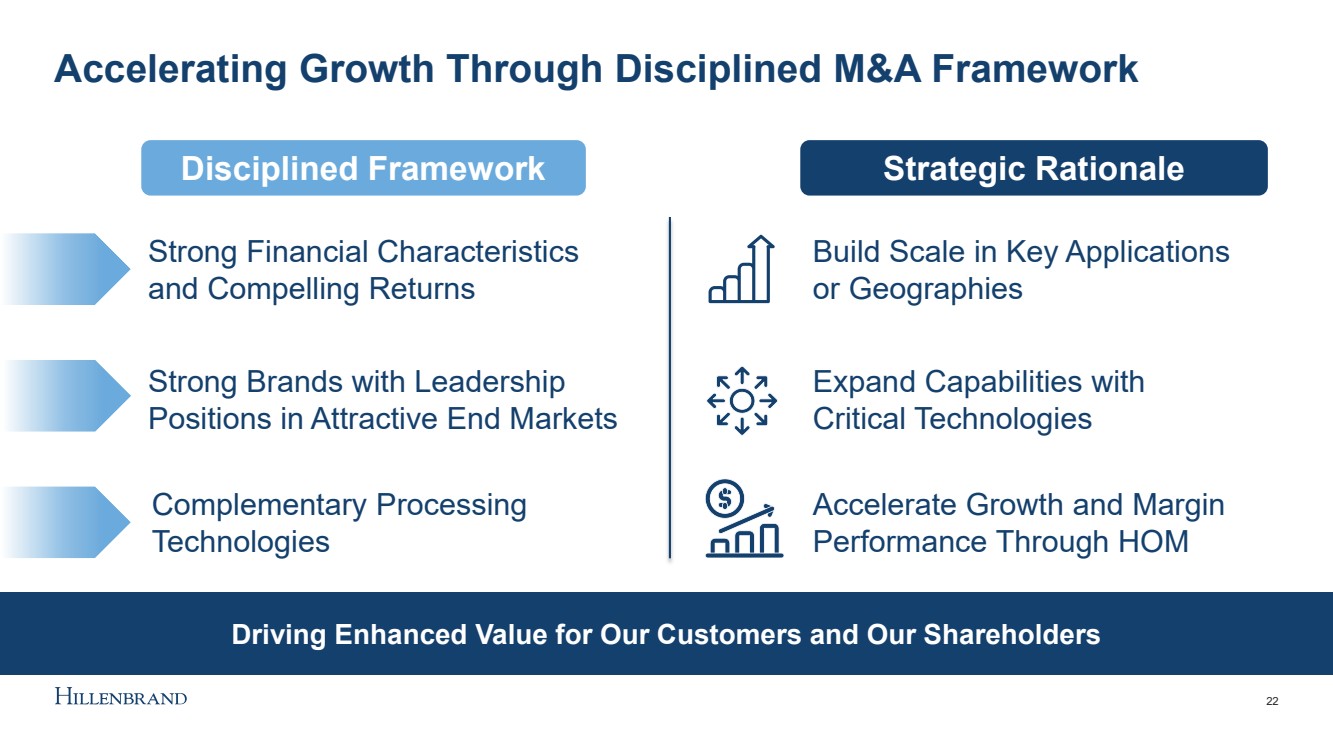
| Accelerating Growth Through Disciplined M&A Framework Strong Financial Characteristics and Compelling Returns Strong Brands with Leadership Positions in Attractive End Markets Complementary Processing Technologies 22 Expand Capabilities with Critical Technologies Accelerate Growth and Margin Performance Through HOM Build Scale in Key Applications or Geographies Disciplined Framework Strategic Rationale Disciplined Framework Strategic Rationale Driving Enhanced Value for Our Customers and Our Shareholders |
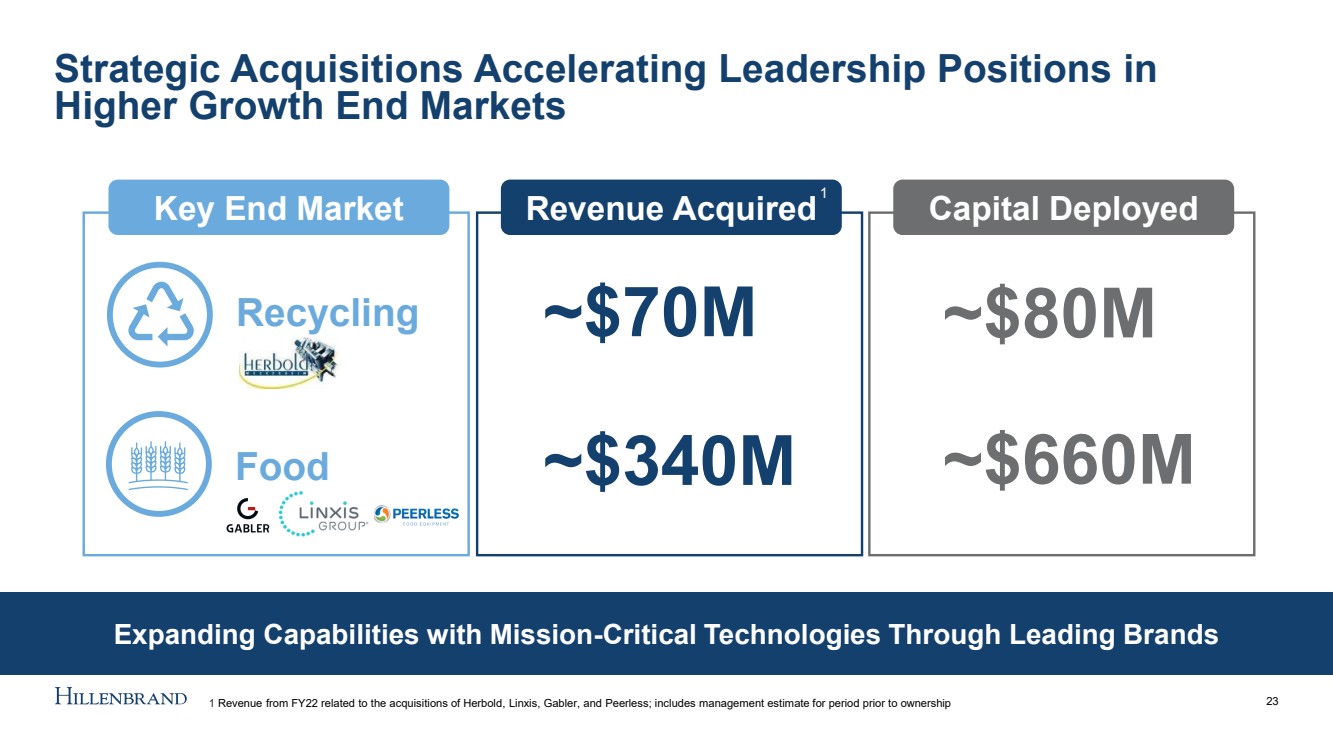
| Expanding Capabilities with Mission - Critical Technologies Through Leading Brands Strategic Acquisitions Accelerating Leadership Positions in Higher Growth End Markets 23 Key End Market Revenue Acquired Capital Deployed ~$70M ~$340M ~$660M ~$80M Recycling Food 1 1 Revenue from FY22 related to the acquisitions of Herbold, Linxis , Gabler, and Peerless; includes management estimate for period prior to ownership |
| Our Renewed Strategy to Drive the Next Chapter of Growth Continuous Improvement Driven by HOM Enhance Optimize 24 Grow |
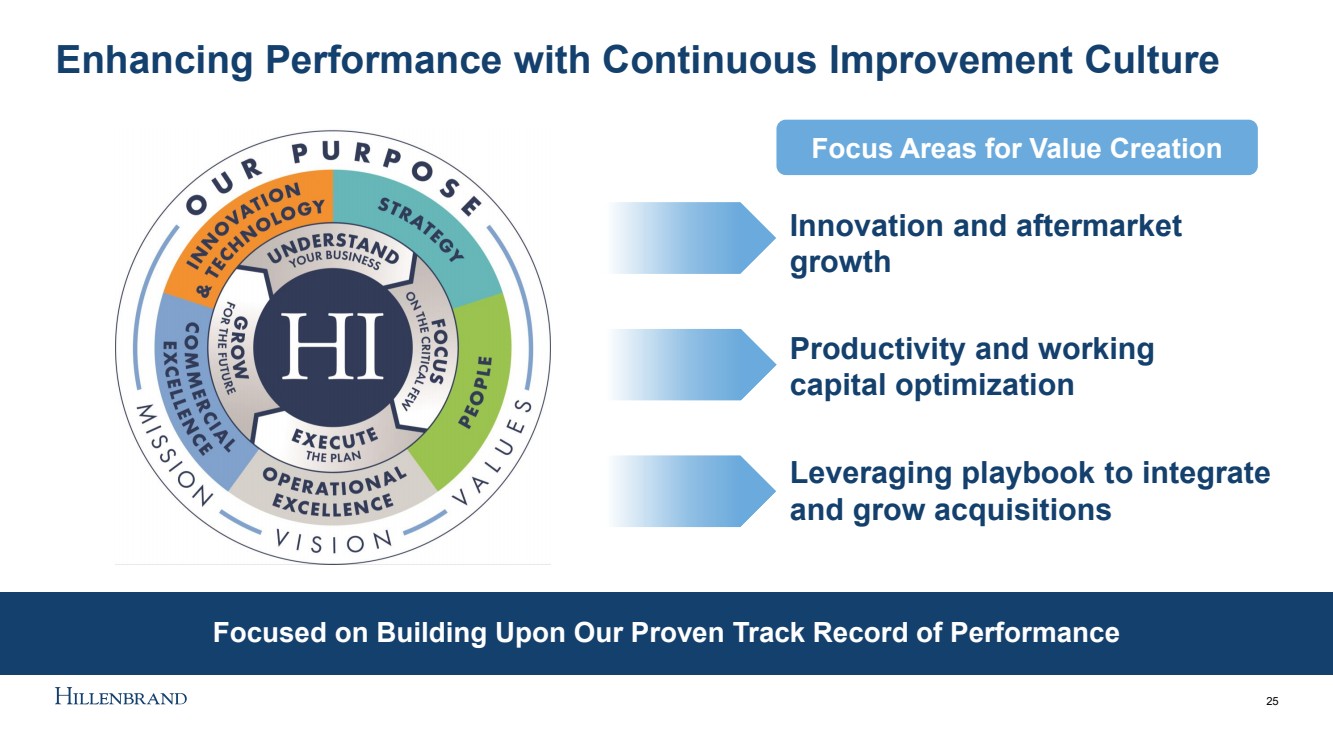
| Focused on Building Upon Our Proven Track Record of Performance Key Priorities Innovation and aftermarket growth Enhancing Performance with Continuous Improvement Culture 25 Productivity and working capital optimization Leveraging playbook to integrate and grow acquisitions Focus Areas for Value Creation |
| Our Renewed Strategy to Drive the Next Chapter of Growth Effective Capital Allocation for Long - Term Shareholder Value Enhance Optimize 26 Grow |
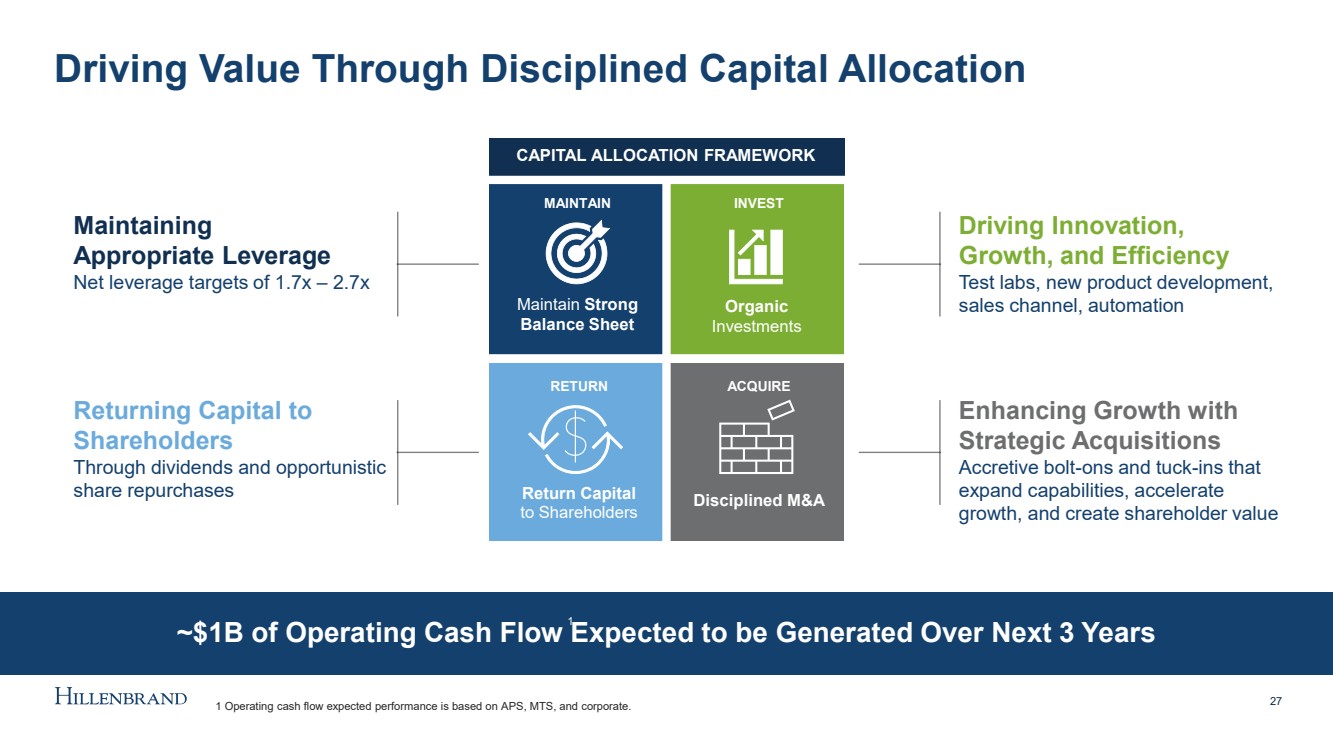
| ~$1B of Operating Cash Flow Expected to be Generated Over Next 3 Years Driving Value Through Disciplined Capital Allocation 27 Returning Capital to Shareholders Through dividends and opportunistic share repurchases Enhancing Growth with Strategic Acquisitions Accretive bolt - ons and tuck - ins that expand capabilities, accelerate growth, and create shareholder value Driving Innovation, Growth, and Efficiency Test labs, new product development, sales channel, automation MAINTAIN INVEST RETURN ACQUIRE CAPITAL ALLOCATION FRAMEWORK Maintain Strong Balance Sheet Organic Investments Return Capital to Shareholders Disciplined M&A Maintaining Appropriate Leverage Net leverage targets of 1.7x – 2.7x 1 Operating cash flow expected performance is based on APS, MTS, and corporate. 1 |
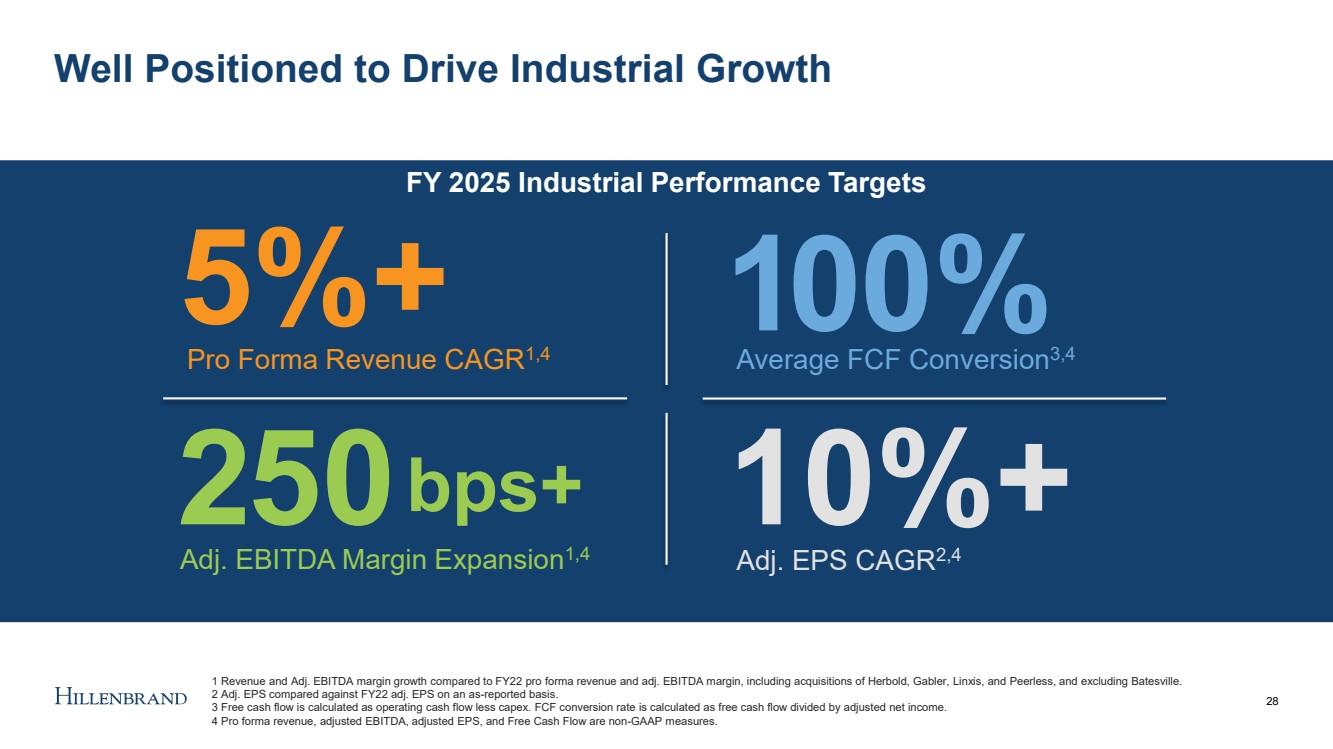
| FY 2025 Industrial Performance Targets Well Positioned to Drive Industrial Growth 28 5%+ Pro Forma Revenue CAGR 1,4 2 50 Adj. EBITDA Margin Expansion 1,4 bps+ Average FCF Conversion 3,4 1 0 0% 1 Revenue and Adj. EBITDA margin growth compared to FY22 pro forma revenue and adj. EBITDA margin, including acquisitions of Herbold, Gabler, Linxis , and Peerless, and excluding Batesville. 2 Adj. EPS compared against FY22 adj. EPS on an as - reported basis. 3 Free cash flow is calculated as operating cash flow less capex. FCF conversion rate is calculated as free cash flow divided by adjusted net income. 4 Pro forma revenue, adjusted EBITDA, adjusted EPS, and Free Cash Flow are non - GAAP measures. 10%+ Adj. EPS CAGR 2,4 |
| Key Takeaways 29 Pure - play global industrial leader in highly - engineered, mission - critical processing solutions serving customers throughout the product lifecycle Well positioned for long - term growth in attractive end markets aligned with secular macro trends Proven track record of performance enabled by the Hillenbrand Operating Model Focused on maximizing shareholder value through our disciplined capital allocation framework Embedded purpose throughout our organization to drive our commitment to support a more sustainable future for all stakeholders |
| Hillenbrand Operating Model Leo Kulmaczewski – SVP, Operations & HOM 30 |
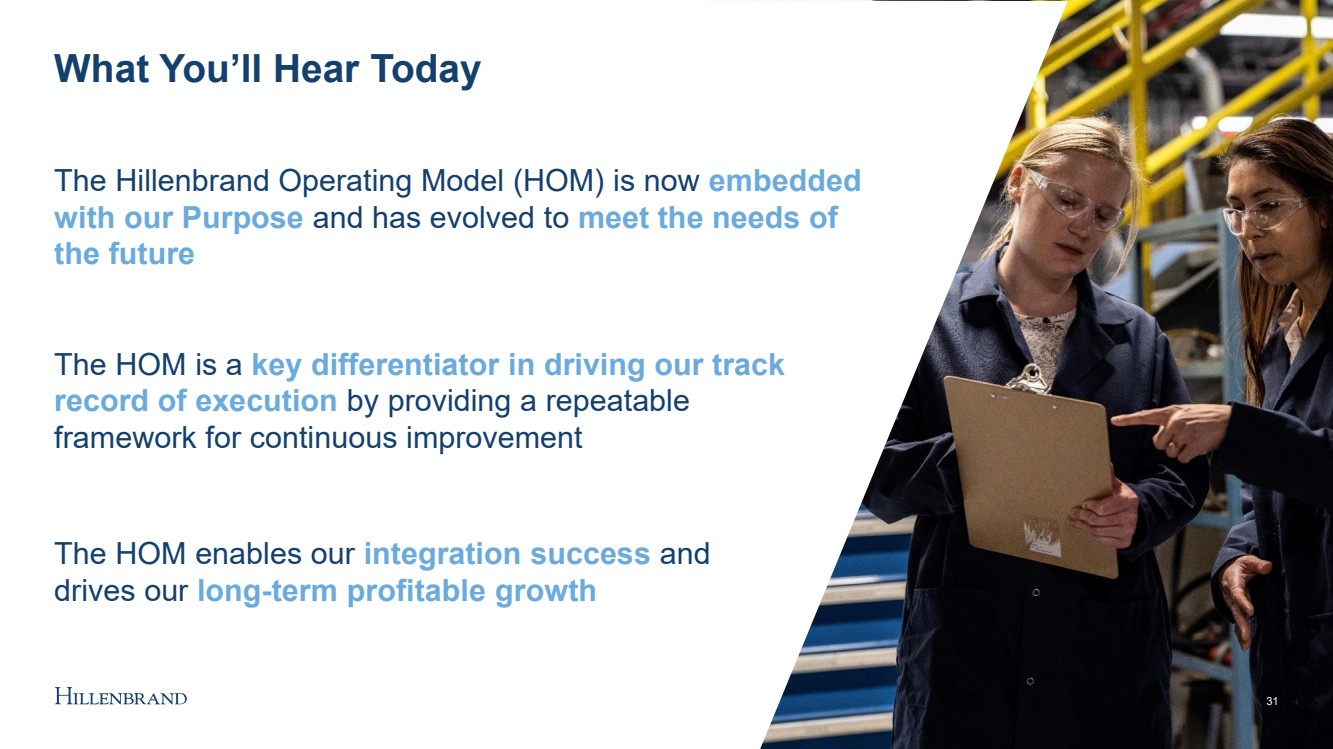
| The Hillenbrand Operating Model (HOM) is now embedded with our Purpose and has evolved to meet the needs of the future The HOM is a key differentiator in driving our track record of execution by providing a repeatable framework for continuous improvement The HOM enables our integration success and drives our long - term profitable growth What You’ll Hear Today 31 |
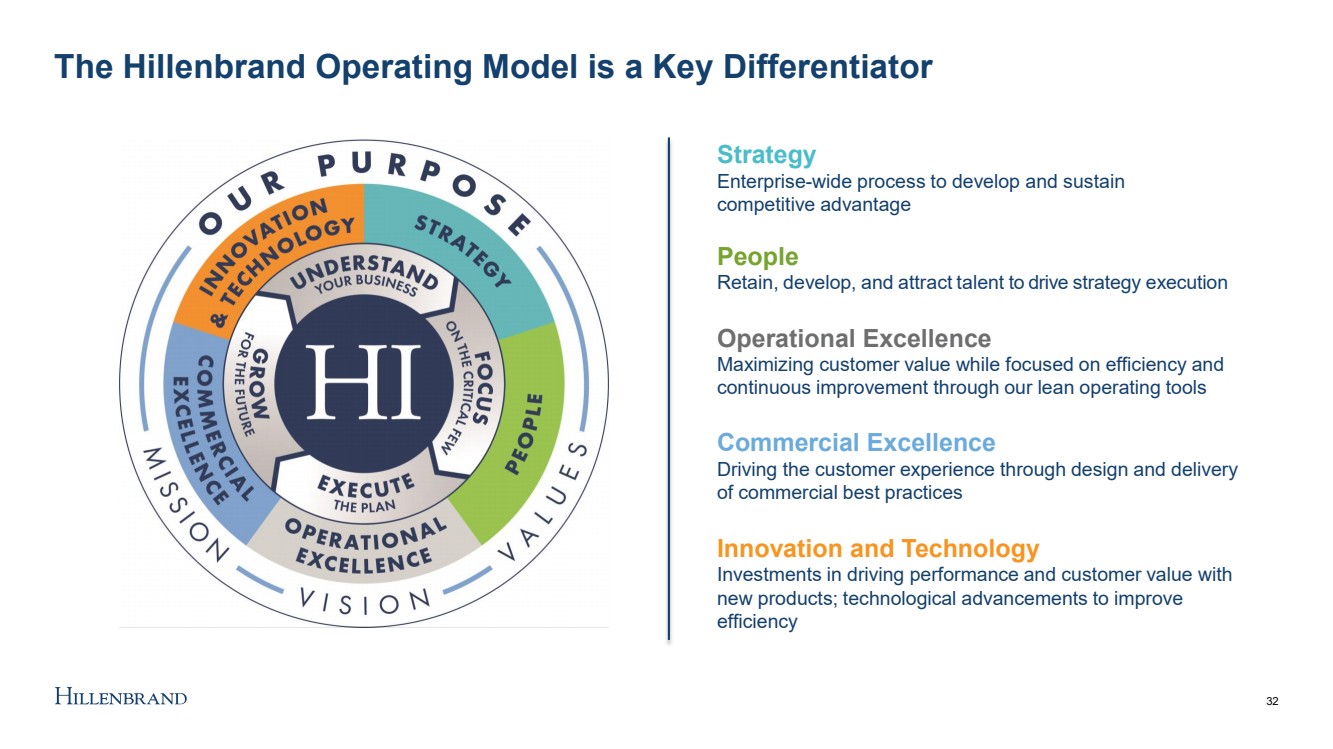
| The Hillenbrand Operating Model is a Key Differentiator Strategy Enterprise - wide process to develop and sustain competitive advantage People Retain, develop, and attract talent to drive strategy execution Operational Excellence Maximizing customer value while focused on efficiency and continuous improvement through our lean operating tools Innovation and Technology Investments in driving performance and customer value with new products; technological advancements to improve efficiency Commercial Excellence Driving the customer experience through design and delivery of commercial best practices 32 |
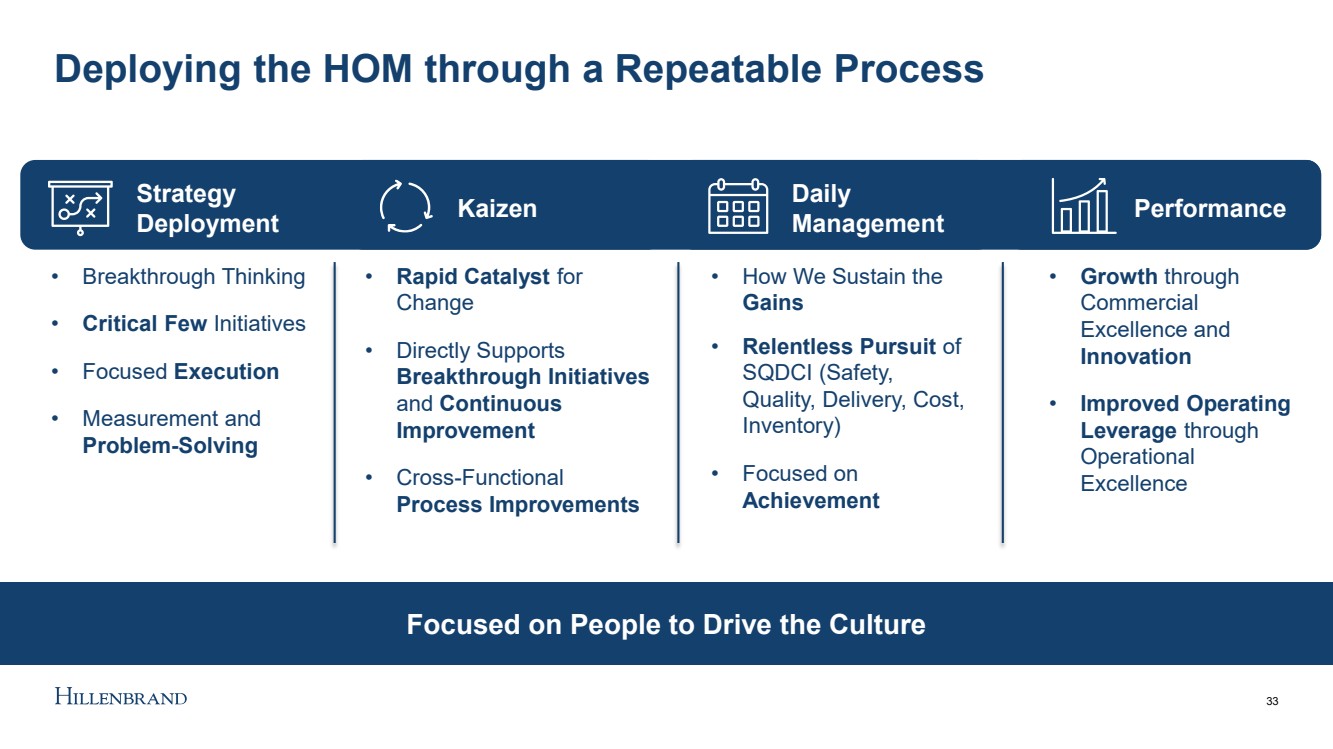
| Deploying the HOM through a Repeatable Process 33 Strategy Deployment Kaizen Daily Management Performance • Breakthrough Thinking • Critical Few Initiatives • Focused Execution • Measurement and Problem - Solving • Rapid Catalyst for Change • Directly Supports Breakthrough Initiatives and Continuous Improvement • Cross - Functional Process Improvements • How We Sustain the Gains • Relentless Pursuit of SQDCI (Safety, Quality, Delivery, Cost, Inventory) • Focused on Achievement • Growth through Commercial Excellence and Innovation • Improved Operating Leverage through Operational Excellence Focused on People to Drive the Culture |
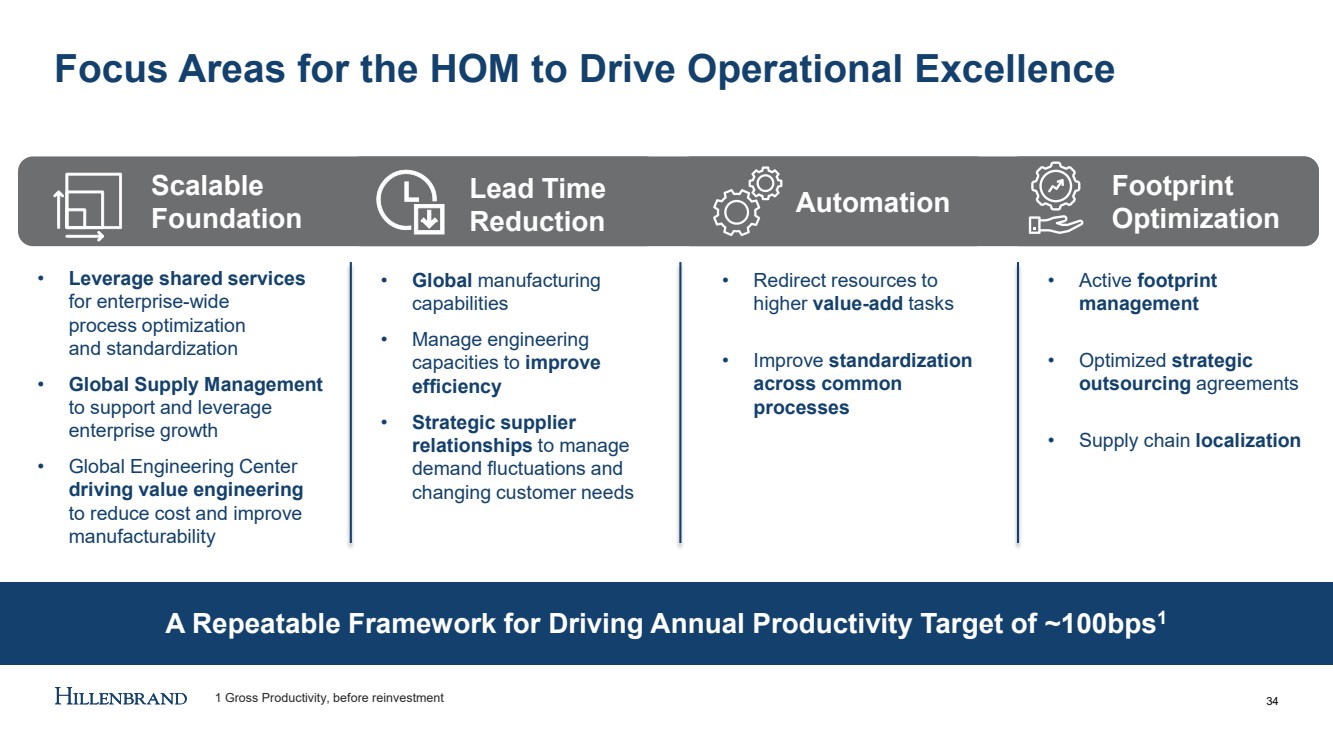
| A Repeatable Framework for Driving Annual Productivity Target of ~100bps 1 Focus Areas for the HOM to Drive Operational Excellence 34 • Leverage shared services for enterprise - wide process optimization and standardization • Global Supply Management to support and leverage enterprise growth • Global Engineering Center driving value engineering to reduce cost and improve manufacturability • Global manufacturing capabilities • Manage engineering capacities to improve efficiency • Strategic supplier relationships to manage demand fluctuations and changing customer needs • Active footprint management • Optimized strategic outsourcing agreements • Supply chain localization • Redirect resources to higher value - add tasks • Improve standardization across common processes Automation Scalable Foundation Footprint Optimization Lead Time Reduction 1 Gross Productivity, before reinvestment |
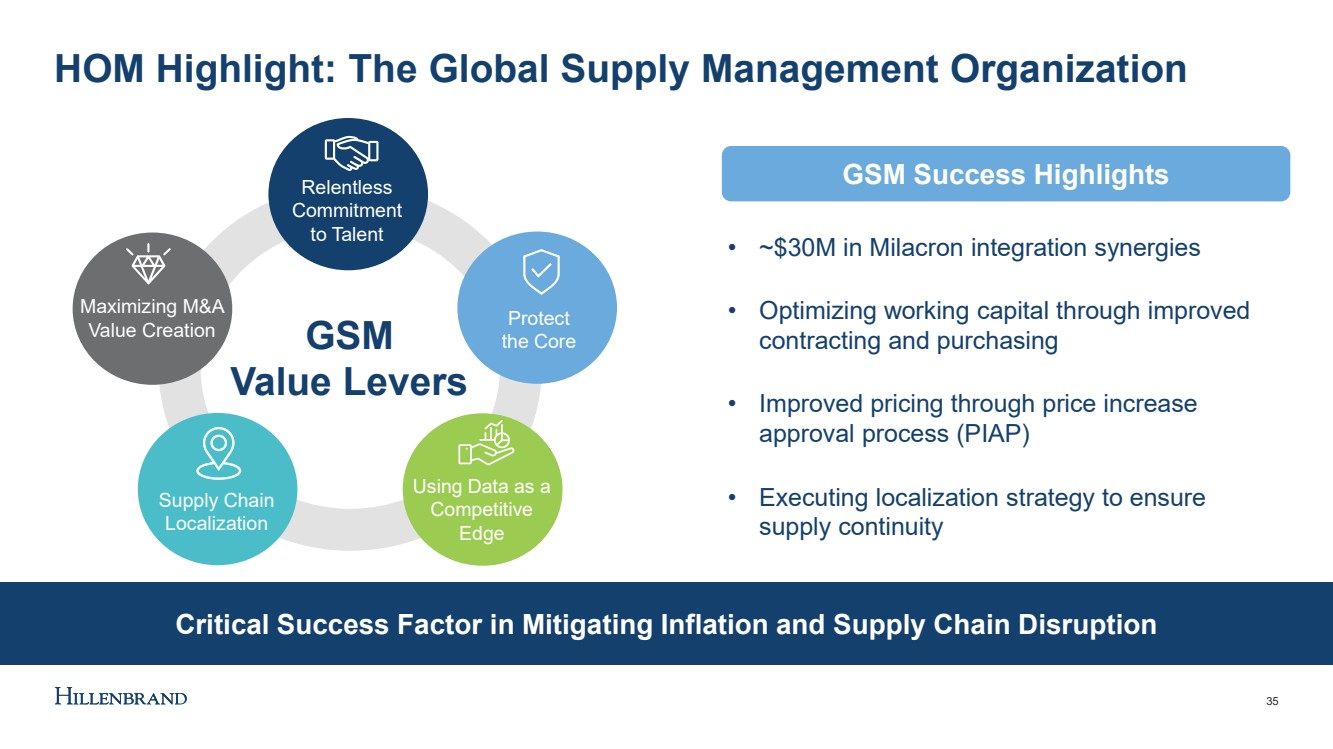
| Critical Success Factor in Mitigating Inflation and Supply Chain Disruption HOM Highlight: The Global Supply Management Organization 35 • ~$30M in Milacron integration synergies • Optimizing working capital through improved contracting and purchasing • Improved pricing through price increase approval process (PIAP) • Executing localization strategy to ensure supply continuity GSM Value Levers Relentless Commitment to Talent Protect the Core Maximizing M&A Value Creation Supply Chain Localization Using Data as a Competitive Edge GSM Success Highlights |
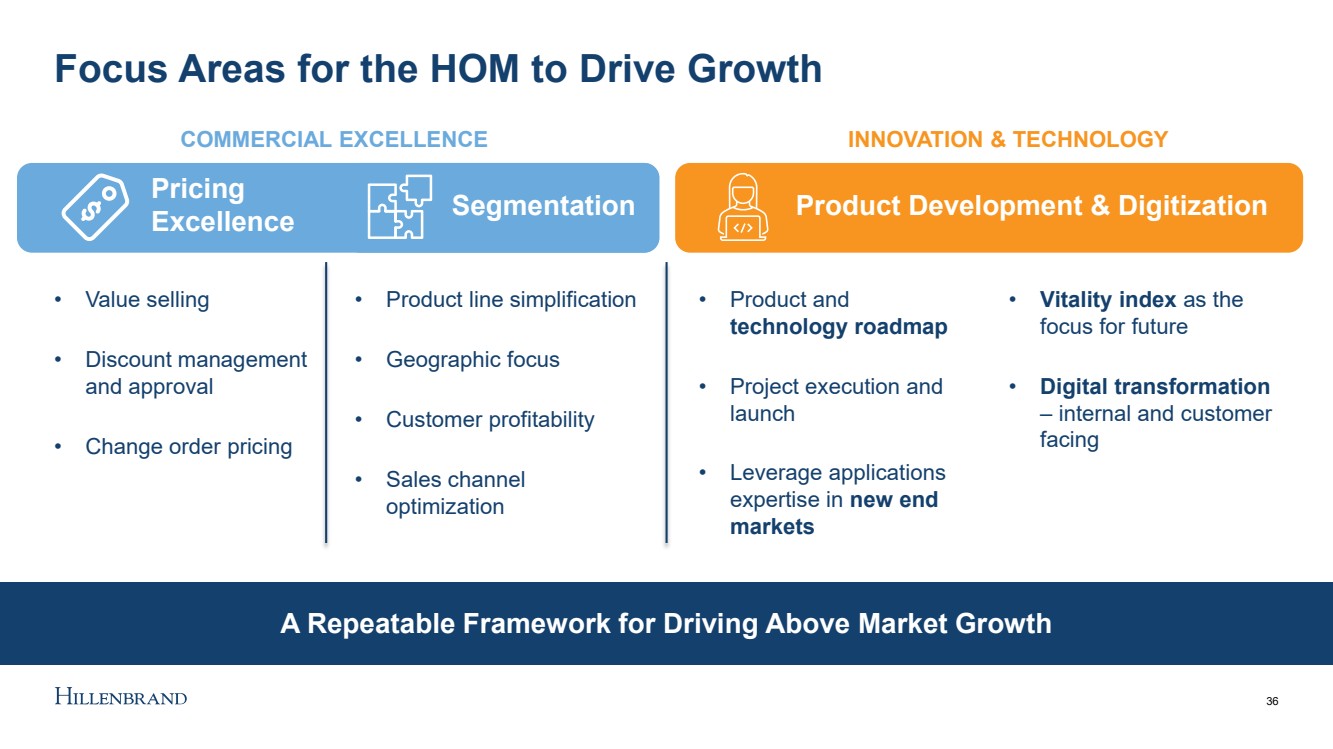
| A Repeatable Framework for Driving Above Market Growth Focus Areas for the HOM to Drive Growth 36 • Value selling • Discount management and approval • Change order pricing • Product line simplification • Geographic focus • Customer profitability • Sales channel optimization • Product and technology roadmap • Project execution and launch • Leverage applications expertise in new end markets • Vitality index as the focus for future • Digital transformation – internal and customer facing Pricing Excellence COMMERCIAL EXCELLENCE Segmentation INNOVATION & TECHNOLOGY Product Development & Digitization |
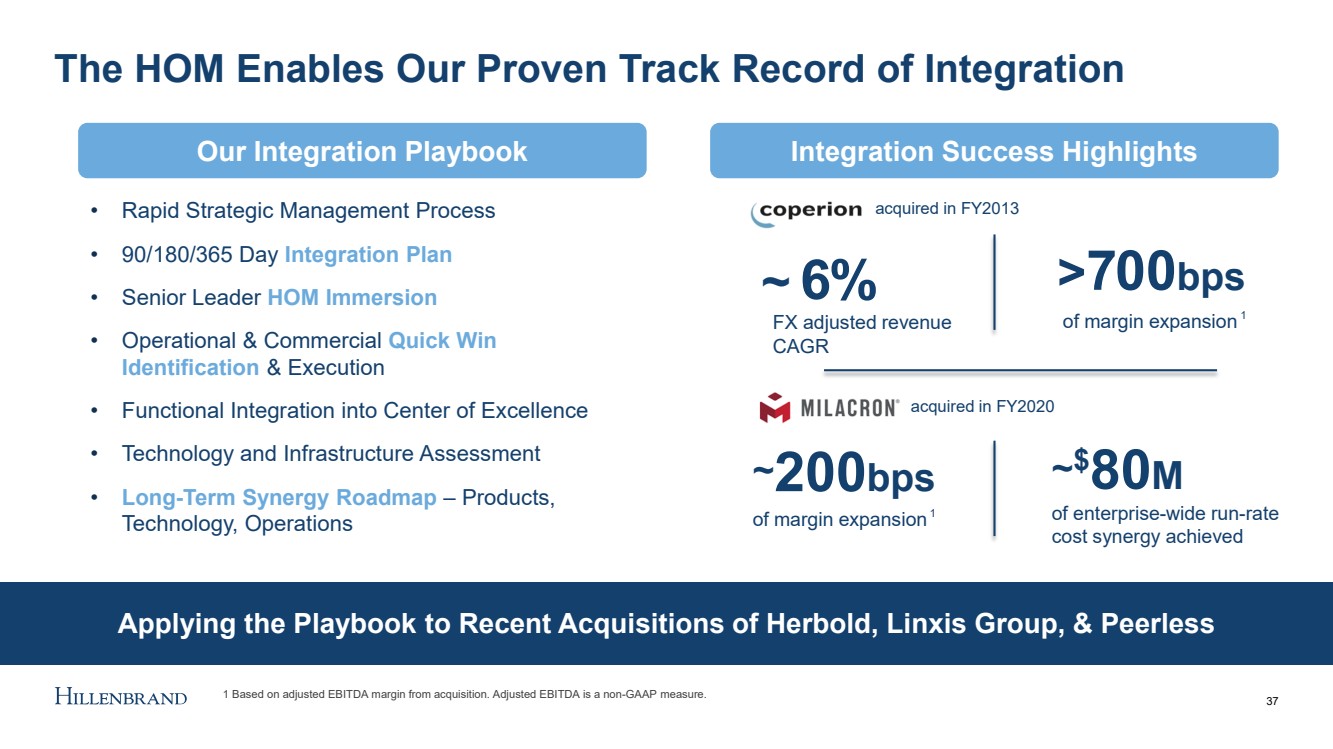
| Applying the Playbook to Recent Acquisitions of Herbold, Linxis Group, & Peerless The HOM Enables Our Proven Track Record of Integration 37 > 7 00 bps of margin expansion ~ $ 80 M of enterprise - wide run - rate cost synergy achieved ~ 200 bps of margin expansion ~ 6 % FX adjusted revenue CAGR • Rapid Strategic Management Process • 90/180/365 Day Integration Plan • Senior Leader HOM Immersion • Operational & Commercial Quick Win Identification & Execution • Functional Integration into Center of Excellence • Technology and Infrastructure Assessment • Long - Term Synergy Roadmap – Products, Technology, Operations acquired in FY2013 acquired in FY2020 Integration Success Highlights Our Integration Playbook 1 Based on adjusted EBITDA margin from acquisition. Adjusted EBITDA is a non - GAAP measure. 1 1 |
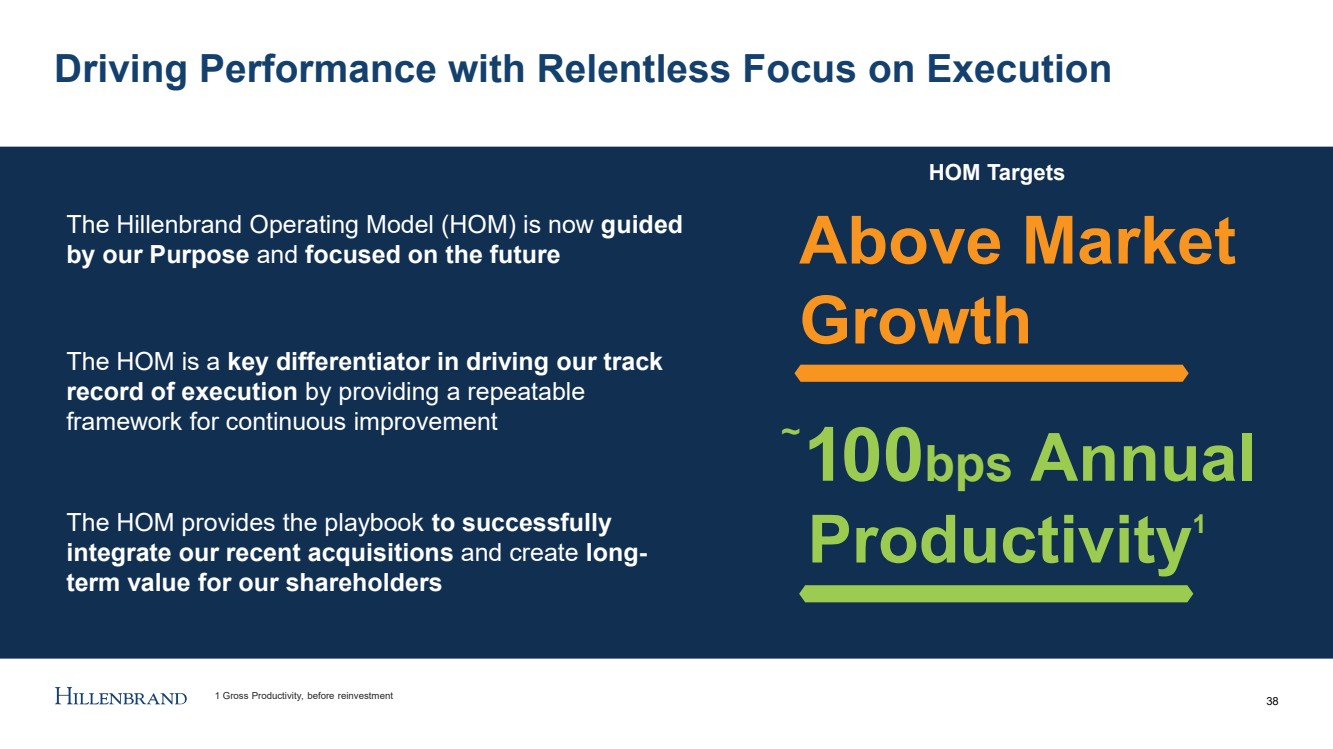
| Driving Performance with Relentless Focus on Execution 38 The Hillenbrand Operating Model (HOM) is now guided by our Purpose and focused on the future The HOM is a key differentiator in driving our track record of execution by providing a repeatable framework for continuous improvement The HOM provides the playbook to successfully integrate our recent acquisitions and create long - term value for our shareholders Above Market Growth ~ 1 00 bps Annual Productivity 1 1 Gross Productivity, before reinvestment HOM Targets |
| Advanced Process Solutions (APS) Ulrich Bartel – SVP & President, APS 39 |

| 40 40 Global leader in highly - engineered solutions for the plastics industry and the only global provider of full systems solutions Accelerating our leadership position in recycling and food to expand our customer offering and create scale Deploying HOM to enhance performance through innovation and aftermarket growth What You’ll Hear Today Executing our proven integration playbook to drive synergy realization from recent acquisitions |
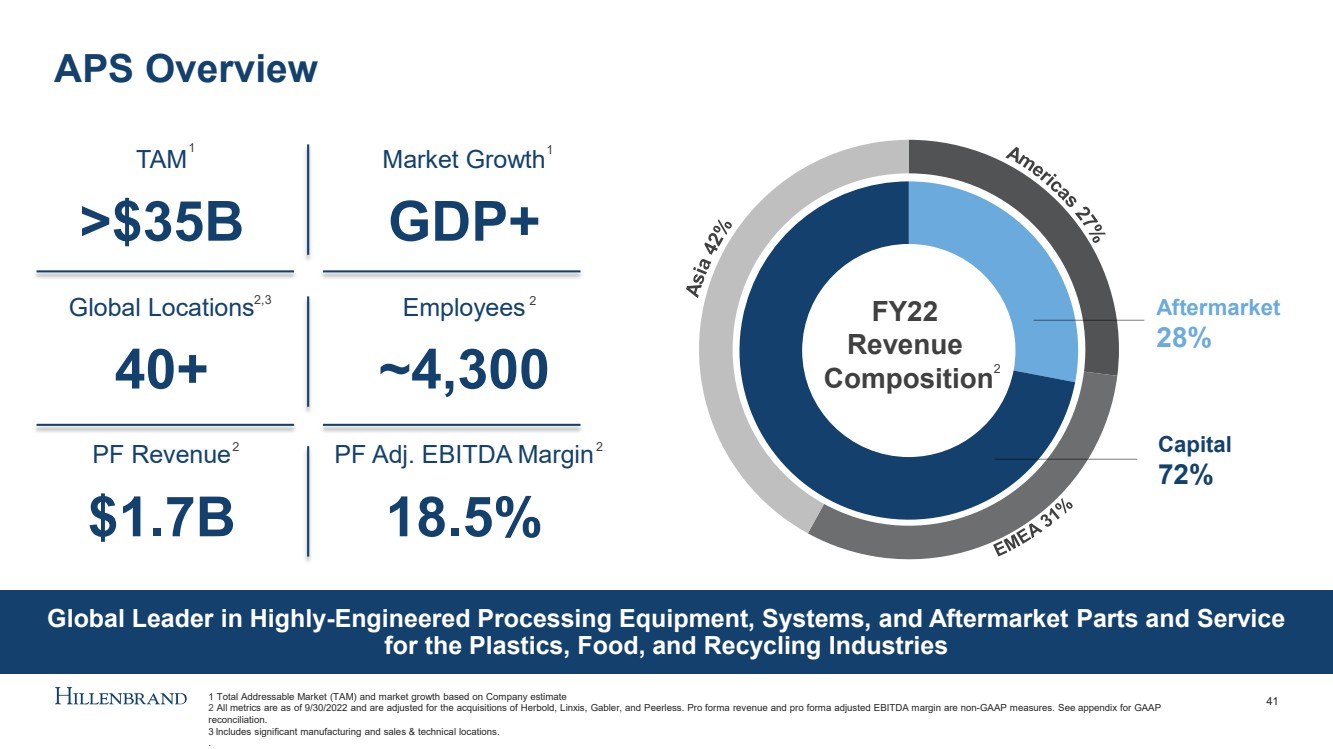
| APS Overview 41 TAM >$35B Market Growth GDP+ Global Locations 40+ Employees ~4,300 PF Revenue $1.7B PF Adj. EBITDA Margin 18.5% Global Leader in Highly - Engineered Processing Equipment, Systems, and Aftermarket Parts and Service for the Plastics, Food, and Recycling Industries 40 % FY22 Revenue Composition Capital 72% Aftermarket 28% 1 Total Addressable Market (TAM) and market growth based on Company estimate 2 All metrics are as of 9/30/2022 and are adjusted for the acquisitions of Herbold, Linxis , Gabler, and Peerless. Pro forma revenue and pro forma adjusted EBITDA margin are non - GAAP measures. See appendix for GAAP reconciliation. 3 Includes significant manufacturing and sales & technical locations. .. 1 2,3 2 2 2 2 1 |
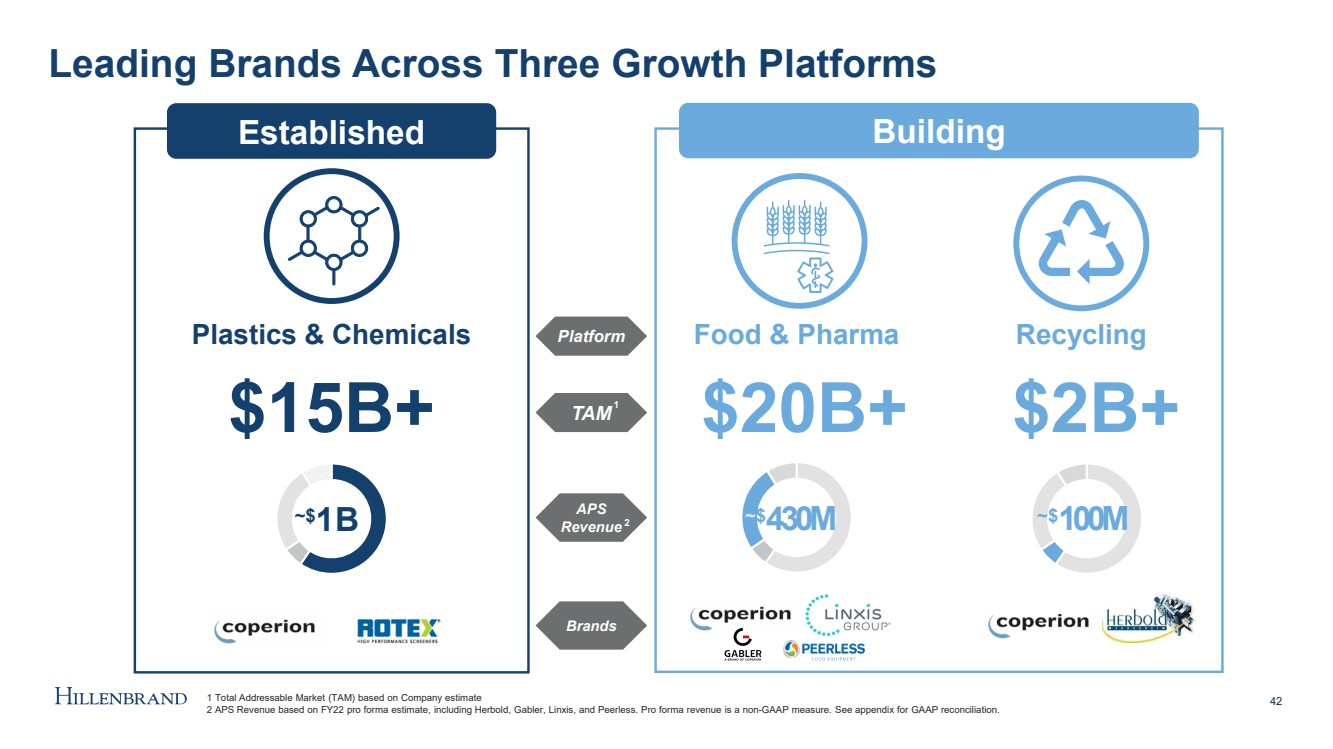
| Leading Brands Across Three Growth Platforms 42 Established Building Food & Pharma Recycling Plastics & Chemicals $15B+ $20B+ $2B+ ~$ 1 B ~ $ 430M ~$ 100M Platform TAM APS Revenue 1 2 1 Total Addressable Market (TAM) based on Company estimate 2 APS Revenue based on FY22 pro forma estimate, including Herbold, Gabler, Linxis , and Peerless. Pro forma revenue is a non - GAAP measure. See appendix for GAAP reconciliation. Brands |
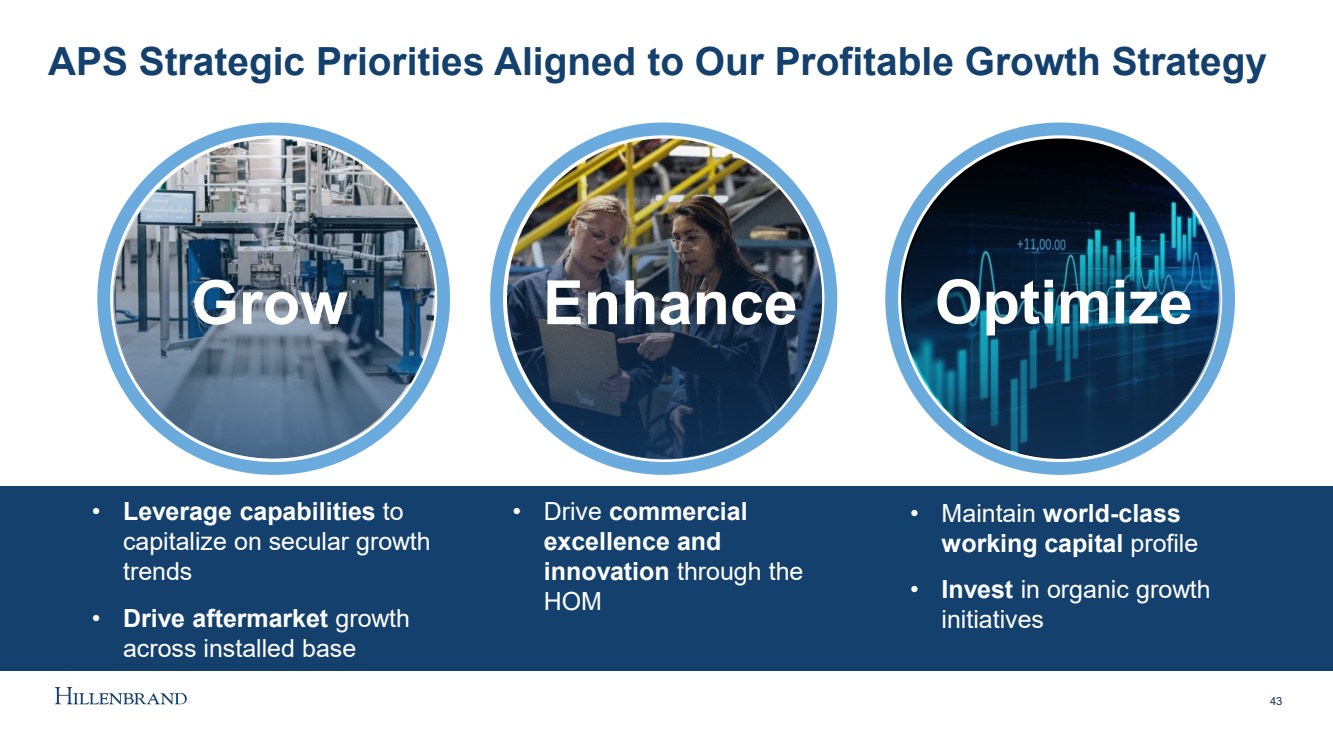
| APS Strategic Priorities Aligned to Our Profitable Growth Strategy Enhance Optimize 43 Grow • Leverage capabilities to capitalize on secular growth trends • Drive aftermarket growth across installed base • Drive commercial excellence and innovation through the HOM • Maintain world - class working capital profile • Invest in organic growth initiatives |
| Strategic Focus on Three Key Growth Platforms 44 Plastics & Chemicals Well Positioned to Leverage Our Plastics Core to Build New Platforms Recycling Food & Pharma |
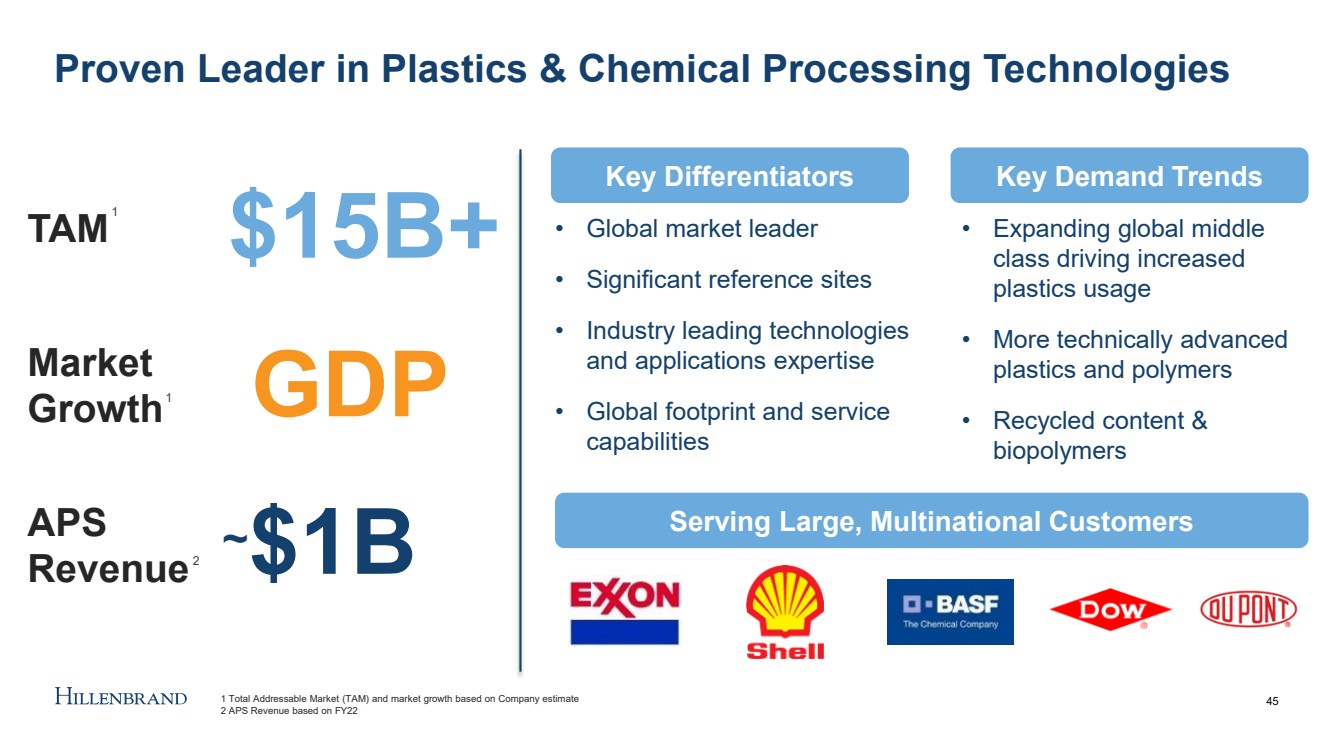
| Proven Leader in Plastics & Chemical Processing Technologies 45 • Global market leader • Significant reference sites • Industry leading technologies and applications expertise • Global footprint and service capabilities TAM APS Revenue Market Growth $15B+ GDP ~ $1B • Expanding global middle class driving increased plastics usage • More technically advanced plastics and polymers • Recycled content & biopolymers Key Differentiators Key Demand Trends Serving Large, Multinational Customers 1 Total Addressable Market (TAM) and market growth based on Company estimate 2 APS Revenue based on FY22 1 2 1 |
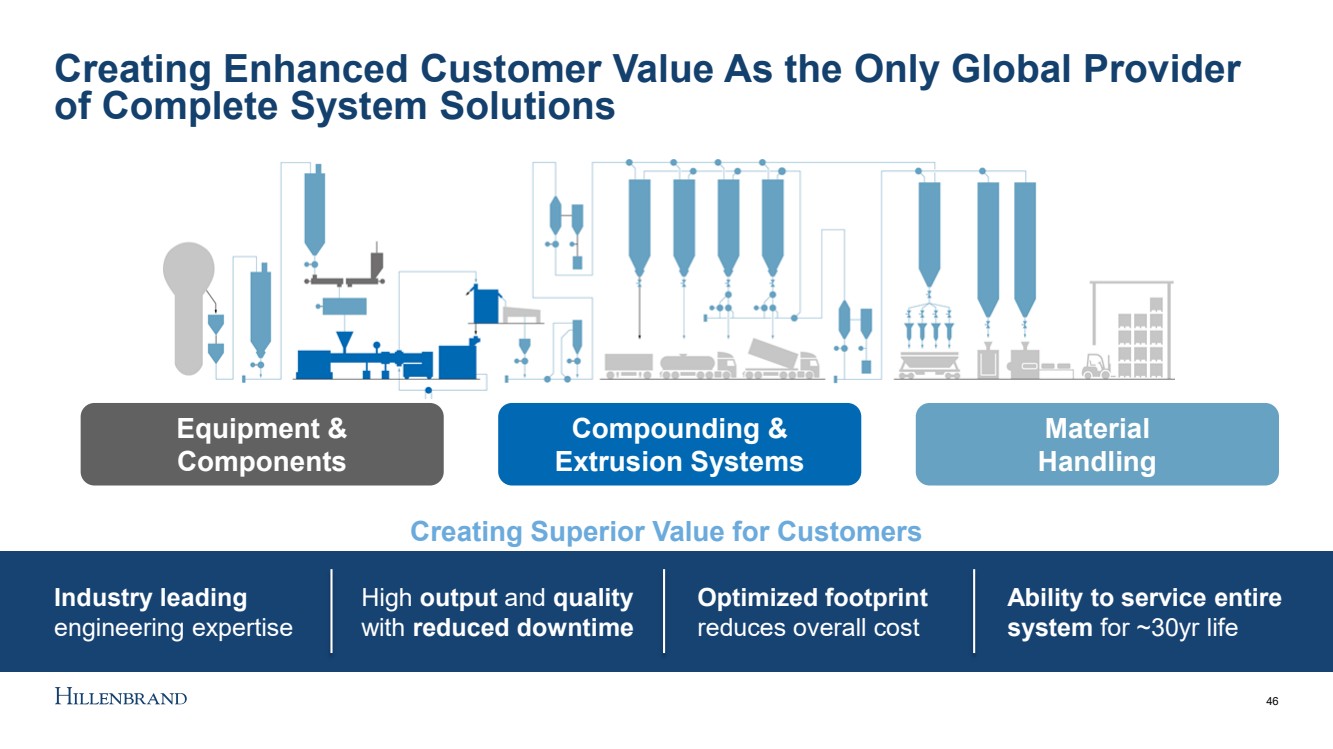
| Creating Enhanced Customer Value As the Only Global Provider of Complete System Solutions Creating Superior Value for Customers Industry leading engineering expertise High output and quality with reduced downtime Optimized footprint reduces overall cost Ability to service entire system for ~30yr life 46 Equipment & Components Compounding & Extrusion Systems Material Handling |
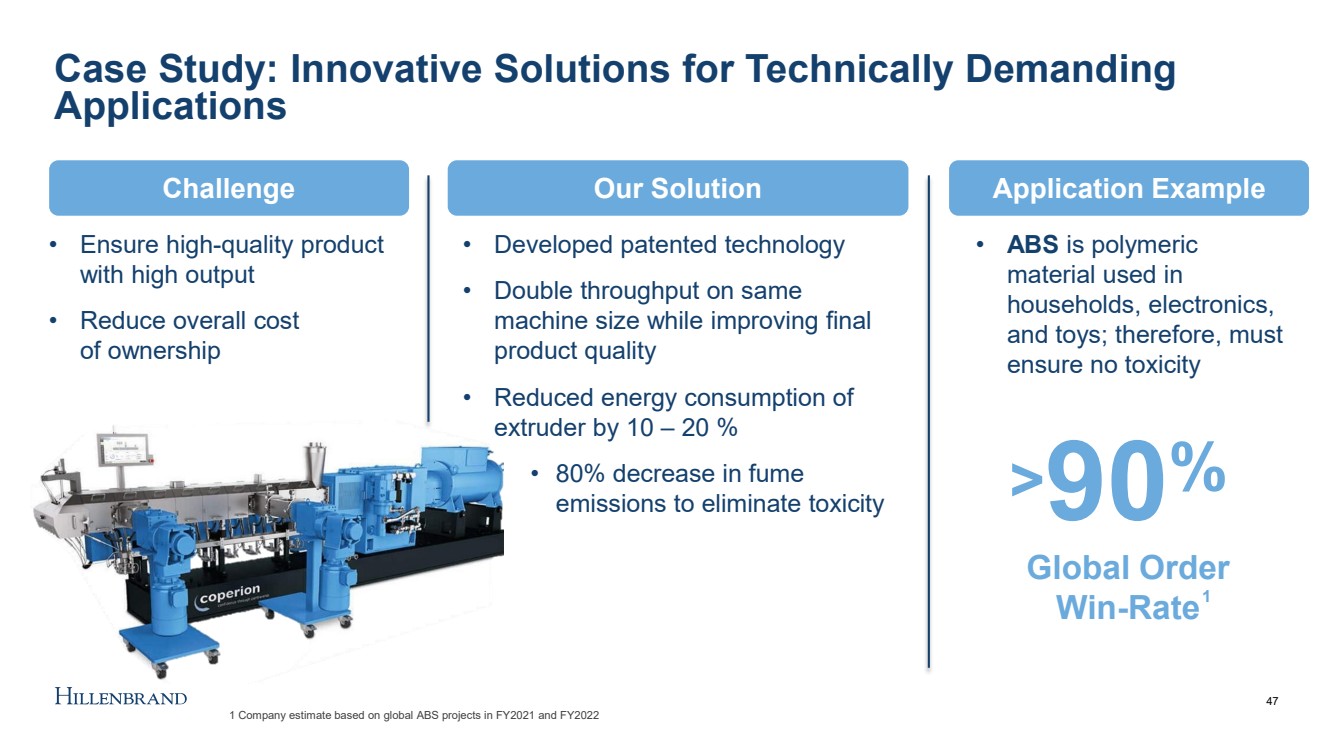
| Case Study: Innovative Solutions for Technically Demanding Applications 47 Global Order Win - Rate • Developed patented technology • Double throughput on same machine size while improving final product quality • Reduced energy consumption of extruder by 10 – 20 % • 80% decrease in fume emissions to eliminate toxicity • ABS is polymeric material used in households, electronics, and toys; therefore, must ensure no toxicity • Ensure high - quality product with high output • Reduce overall cost of ownership > 90 % 1 Company estimate based on global ABS projects in FY2021 and FY2022 Our Solution Application Example Challenge 1 |
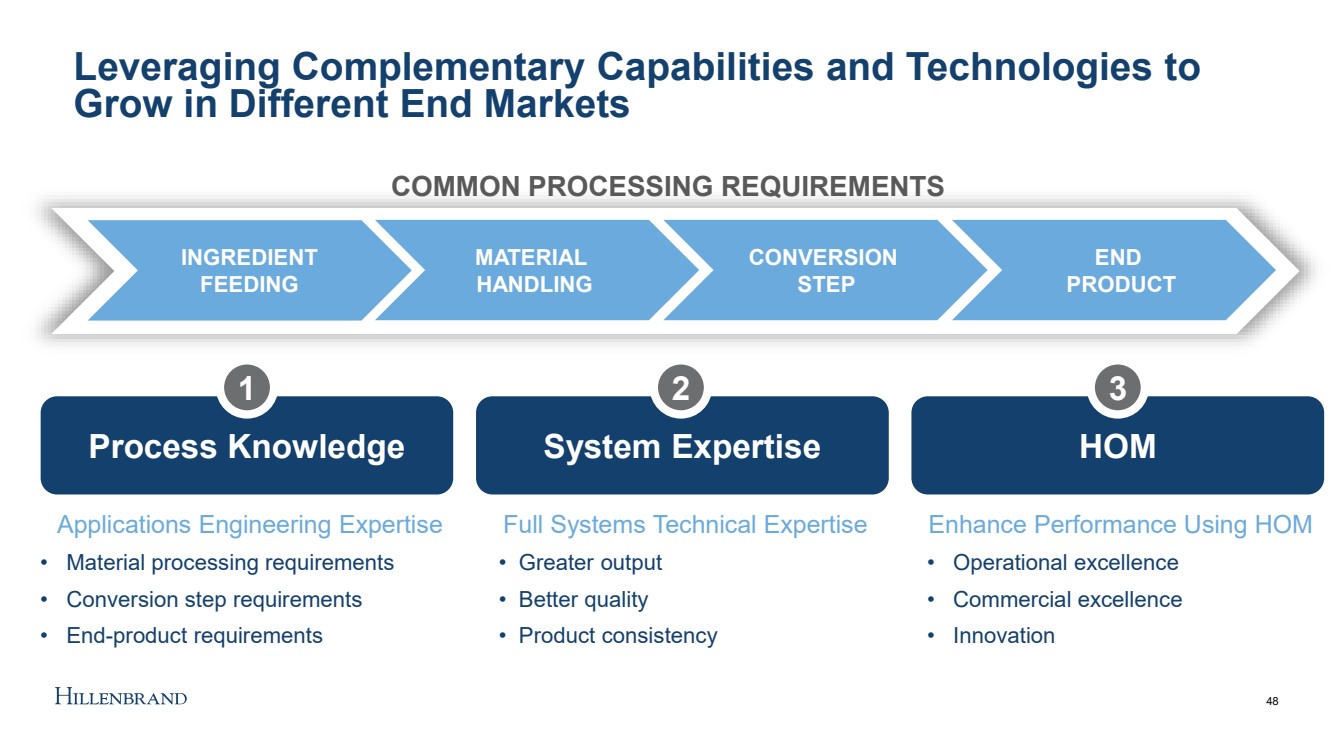
| 48 Leveraging Complementary Capabilities and Technologies to Grow in Different End Markets Applications Engineering Expertise • Material processing requirements • Conversion step requirements • End - product requirements Full Systems Technical Expertise • Greater output • Better quality • Product consistency Enhance Performance Using HOM • Operational excellence • Commercial excellence • Innovation COMMON PROCESSING REQUIREMENTS MATERIAL HANDLING CONVERSION STEP END PRODUCT Process Knowledge 1 System Expertise 2 HOM 3 INGREDIENT FEEDING |
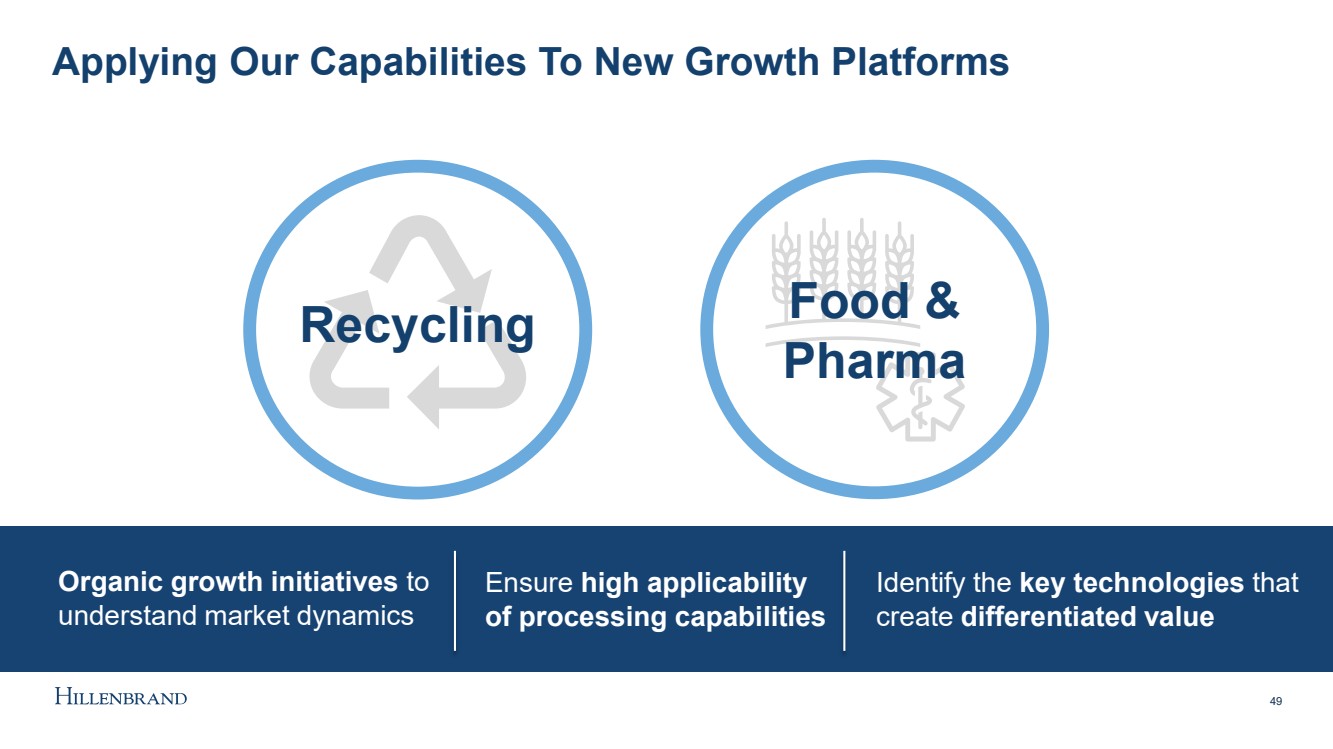
| Applying Our Capabilities To New Growth Platforms 49 Recycling Food & Pharma Organic growth initiatives to understand market dynamics Ensure high applicability of processing capabilities Identify the key technologies that create differentiated value |
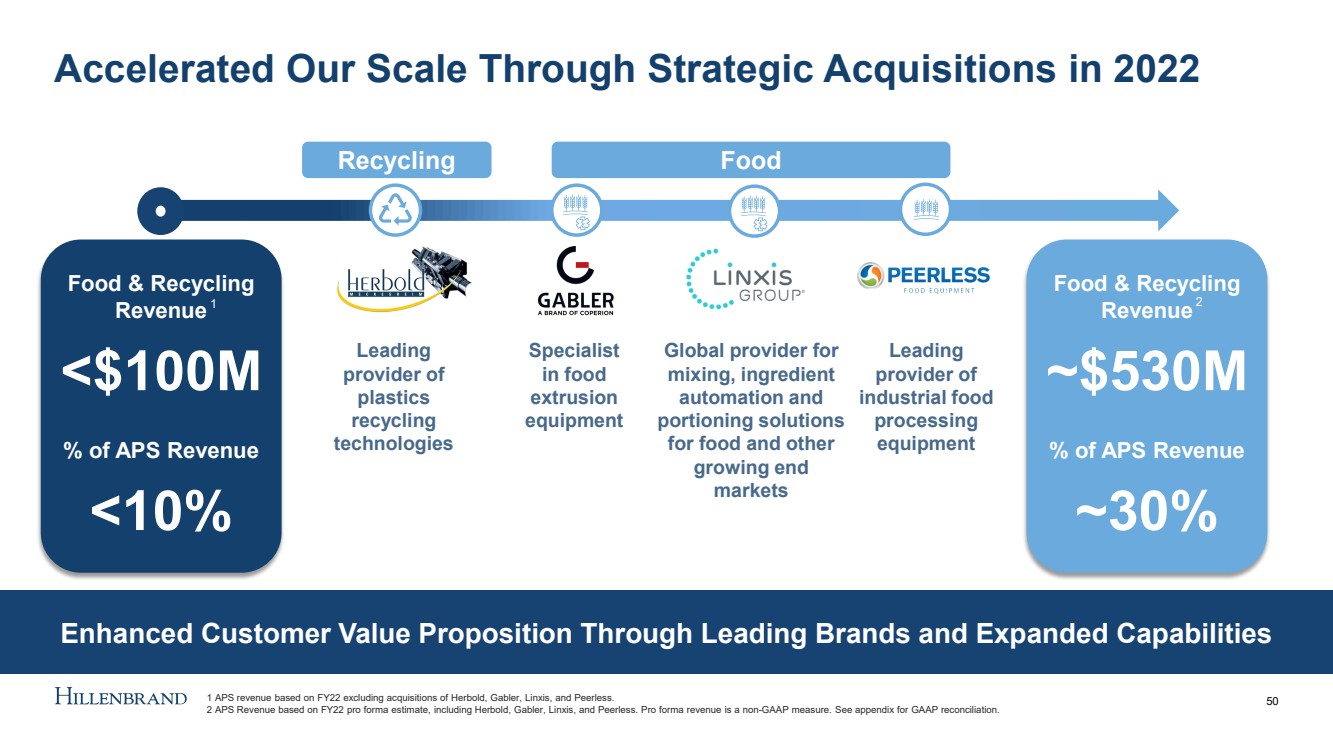
| Accelerated Our Scale Through Strategic Acquisitions in 2022 50 Specialist in food extrusion equipment Leading provider of plastics recycling technologies Global provider for mixing, ingredient automation and portioning solutions for food and other growing end markets Leading provider of industrial food processing equipment Enhanced Customer Value Proposition Through Leading Brands and Expanded Capabilities Food & Recycling Revenue <$100M % of APS Revenue <10% Food & Recycling Revenue ~$530M % of APS Revenue ~30% Recycling Food 1 2 1 APS revenue based on FY22 excluding acquisitions of Herbold, Gabler, Linxis , and Peerless. 2 APS Revenue based on FY22 pro forma estimate, including Herbold, Gabler, Linxis , and Peerless. Pro forma revenue is a non - GAAP measure. See appendix for GAAP reconciliation. |
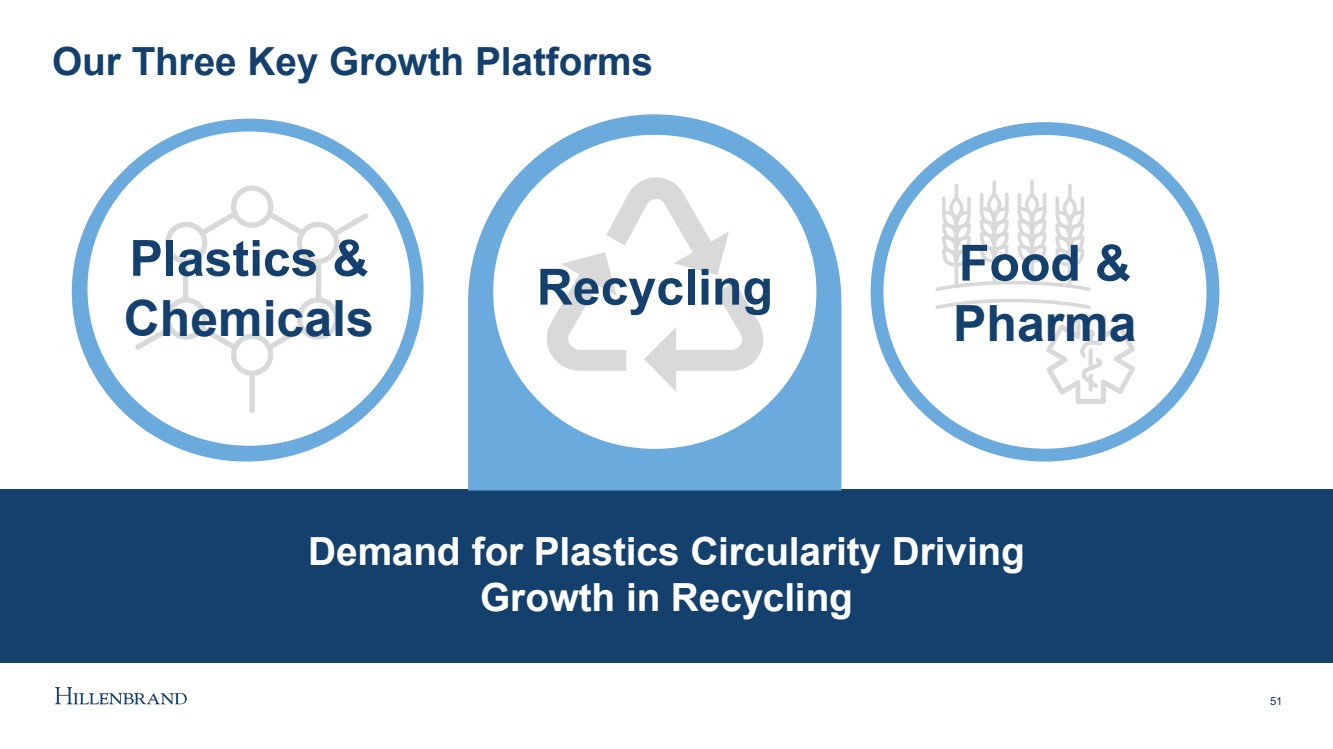
| Our Three Key Growth Platforms 51 Plastics & Chemicals Demand for Plastics Circularity Driving Growth in Recycling Recycling Food & Pharma |
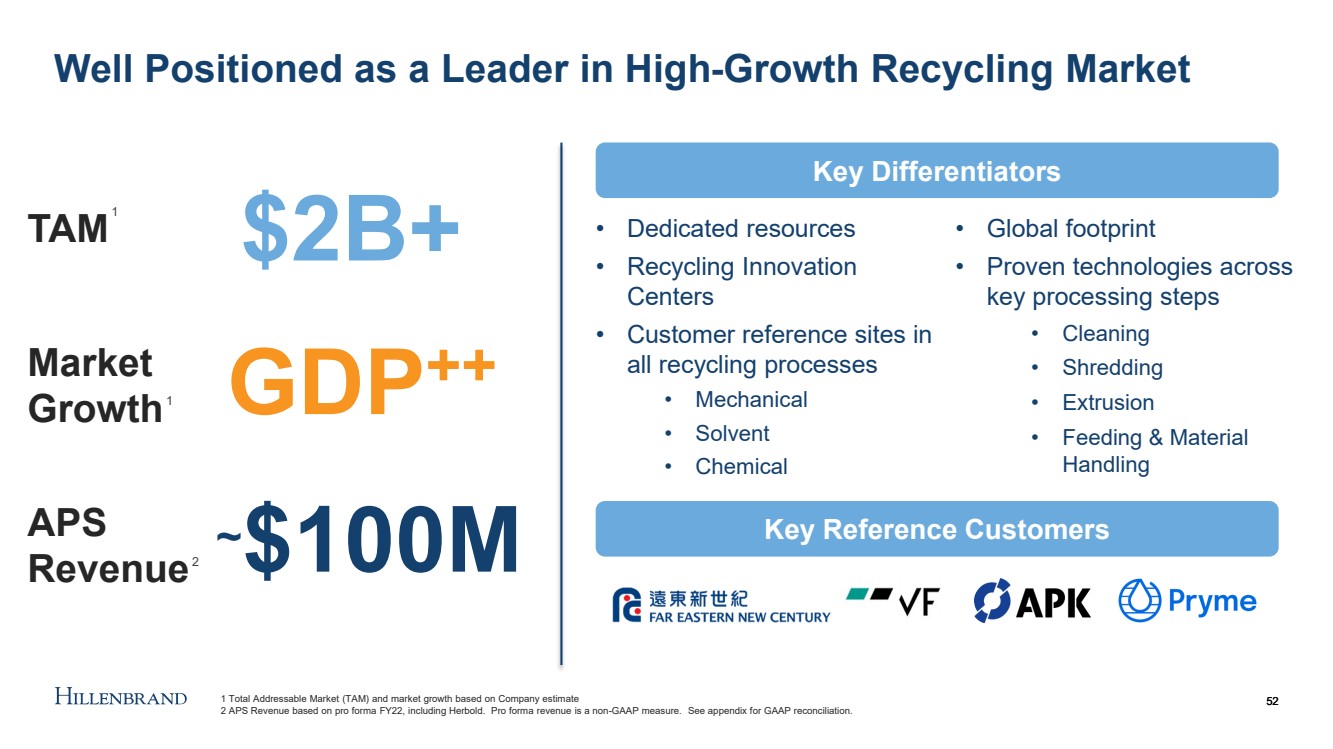
| Well Positioned as a Leader in High - Growth Recycling Market 52 • Dedicated resources • Recycling Innovation Centers • Customer reference sites in all recycling processes • Mechanical • Solvent • Chemical • Global footprint • Proven technologies across key processing steps • Cleaning • Shredding • Extrusion • Feeding & Material Handling 52 Key Differentiators Key Reference Customers TAM APS Revenue Market Growth $2B+ GDP ++ ~ $100M 1 Total Addressable Market (TAM) and market growth based on Company estimate 2 APS Revenue based on pro forma FY22, including Herbold. Pro forma revenue is a non - GAAP measure. See appendix for GAAP reconciliation. 1 2 1 |
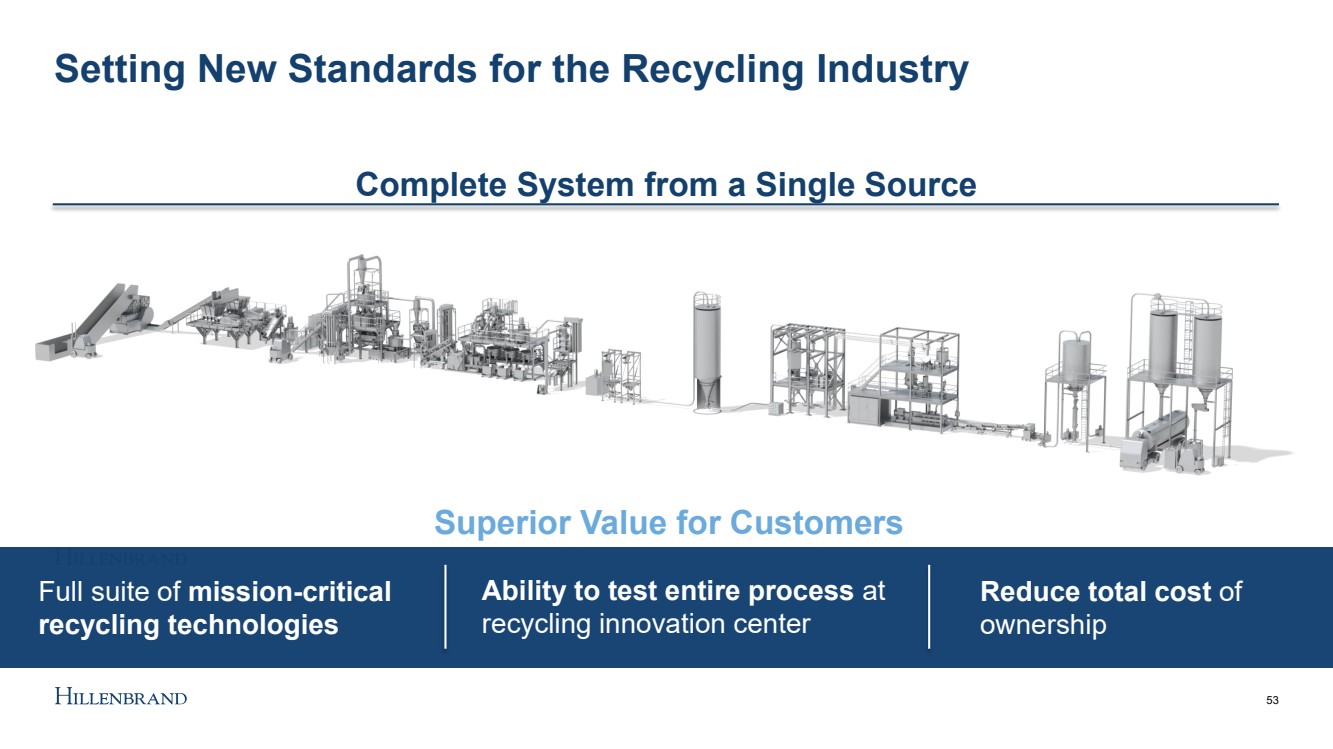
| Setting New Standards for the Recycling Industry Superior Value for Customers Full suite of mission - critical recycling technologies Ability to test entire process at recycling innovation center Reduce total cost of ownership Complete System from a Single Source 53 |
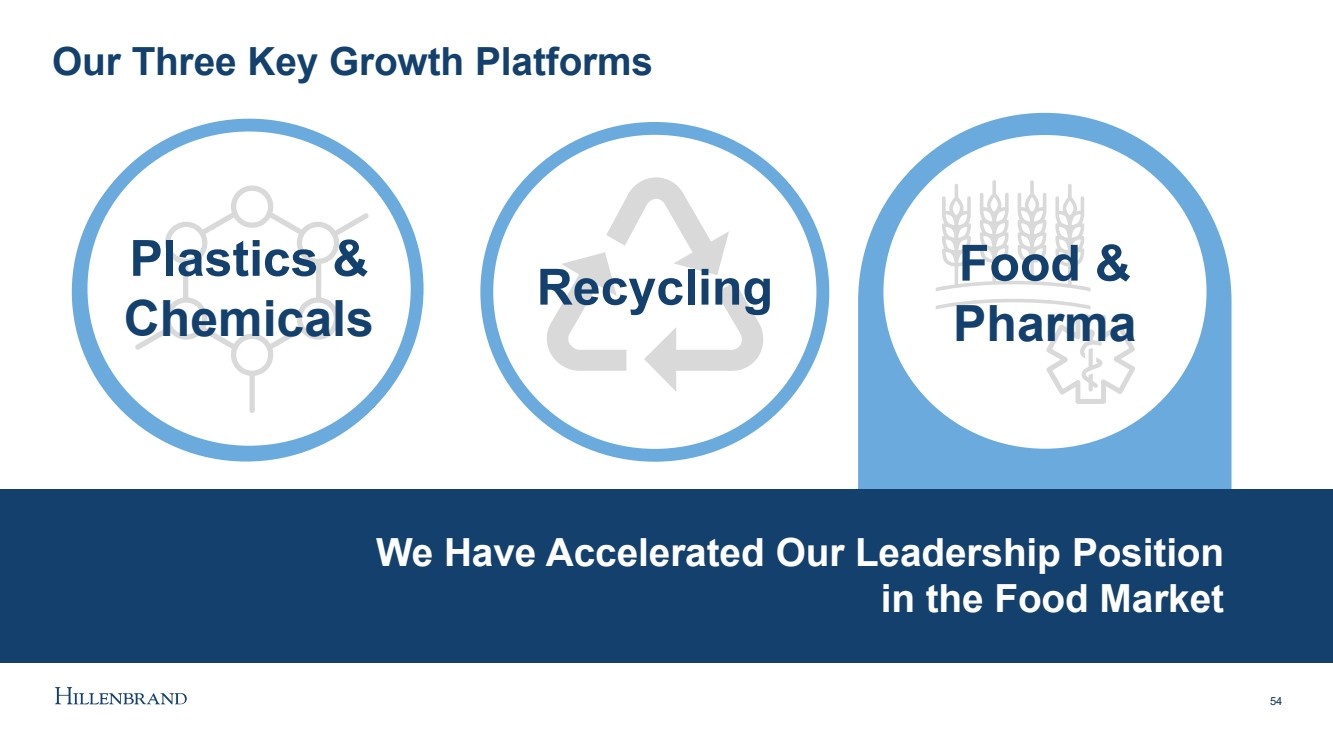
| Our Three Key Growth Platforms 54 Plastics & Chemicals We Have Accelerated Our Leadership Position in the Food Market Recycling Food & Pharma |
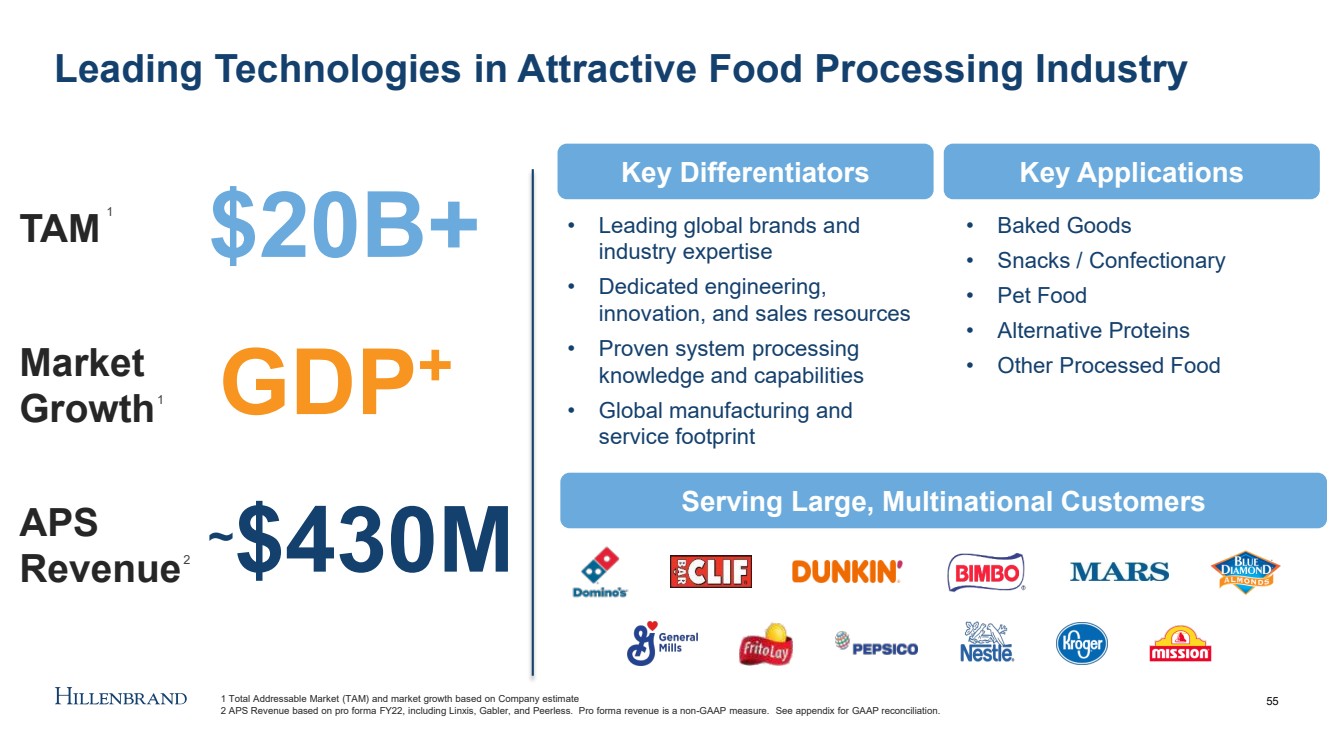
| Leading Technologies in Attractive Food Processing Industry 55 • Leading global brands and industry expertise • Dedicated engineering, innovation, and sales resources • Proven system processing knowledge and capabilities • Global manufacturing and service footprint • Baked Goods • Snacks / Confectionary • Pet Food • Alternative Proteins • Other Processed Food TAM APS Revenue Market Growth $20B+ GDP + ~ $430M Key Differentiators Key Applications Serving Large, Multinational Customers 1 Total Addressable Market (TAM) and market growth based on Company estimate 2 APS Revenue based on pro forma FY22, including Linxis , Gabler, and Peerless. Pro forma revenue is a non - GAAP measure. See appendix for GAAP reconciliation. 1 2 1 |
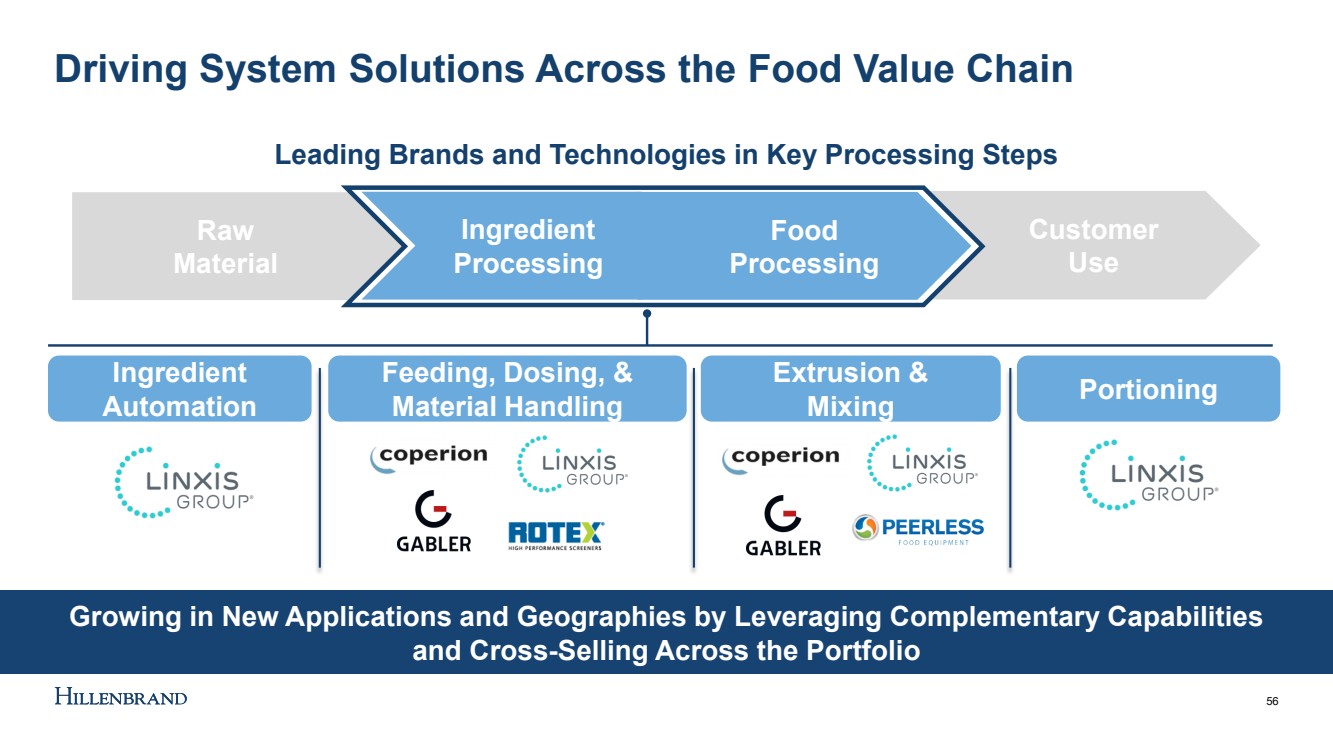
| Driving System Solutions Across the Food Value Chain 56 Portioning Leading Brands and Technologies in Key Processing Steps Growing in New Applications and Geographies by Leveraging Complementary Capabilities and Cross - Selling Across the Portfolio Raw Material Ingredient Processing Food Processing Customer Use Ingredient Automation Feeding, Dosing, & Material Handling Extrusion & Mixing Portioning |
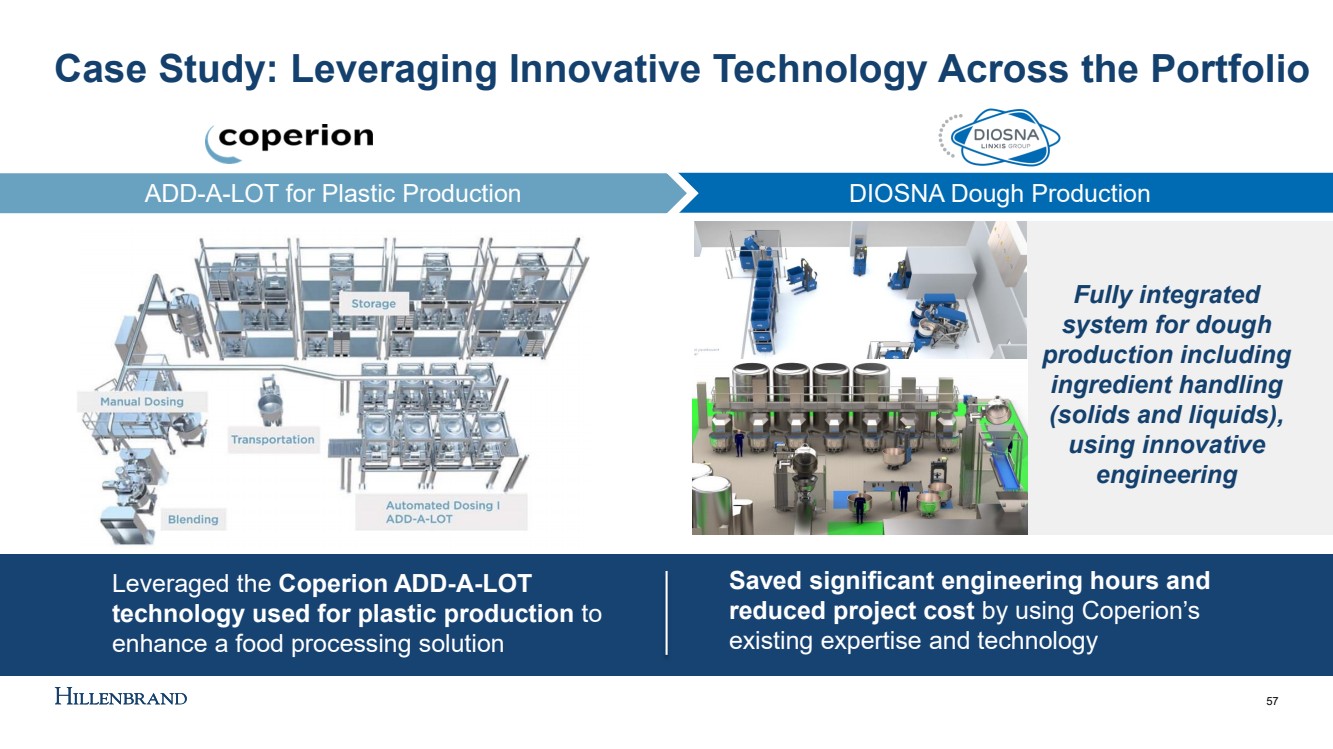
| Case Study: Leveraging Innovative Technology Across the Portfolio 57 ADD - A - LOT for Plastic Production DIOSNA Dough Production Fully integrated system for dough production including ingredient handling (solids and liquids), using innovative engineering Saved significant engineering hours and reduced project cost by using Coperion’s existing expertise and technology Leveraged the Coperion ADD - A - LOT technology used for plastic production to enhance a food processing solution |
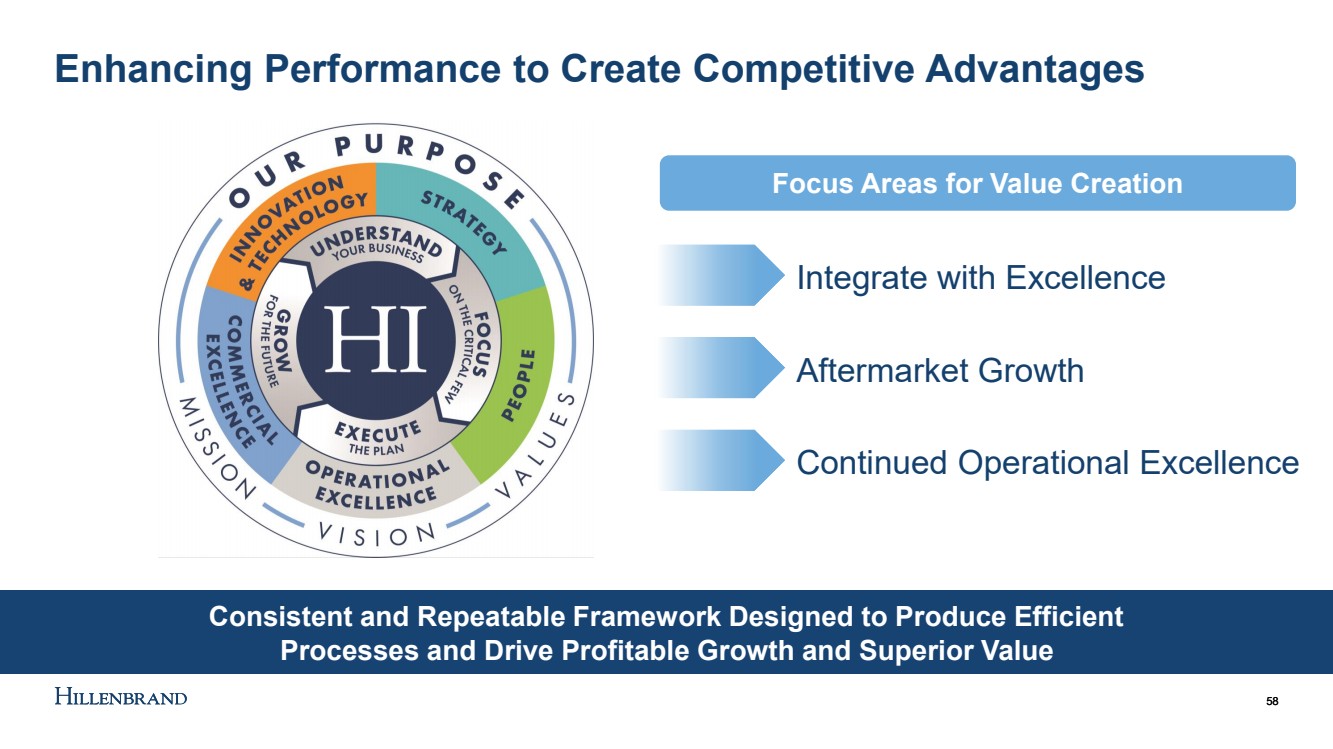
| LEVERAGING CORE TENANTS TO STRENGTHEN FOUNDATION, AND ACCELERATE GROWTH Enhancing Performance to Create Competitive Advantages 58 Consistent and Repeatable Framework Designed to Produce Efficient Processes and Drive Profitable Growth and Superior Value Integrate with Excellence Aftermarket Growth Continued Operational Excellence 58 Focus Areas for Value Creation |
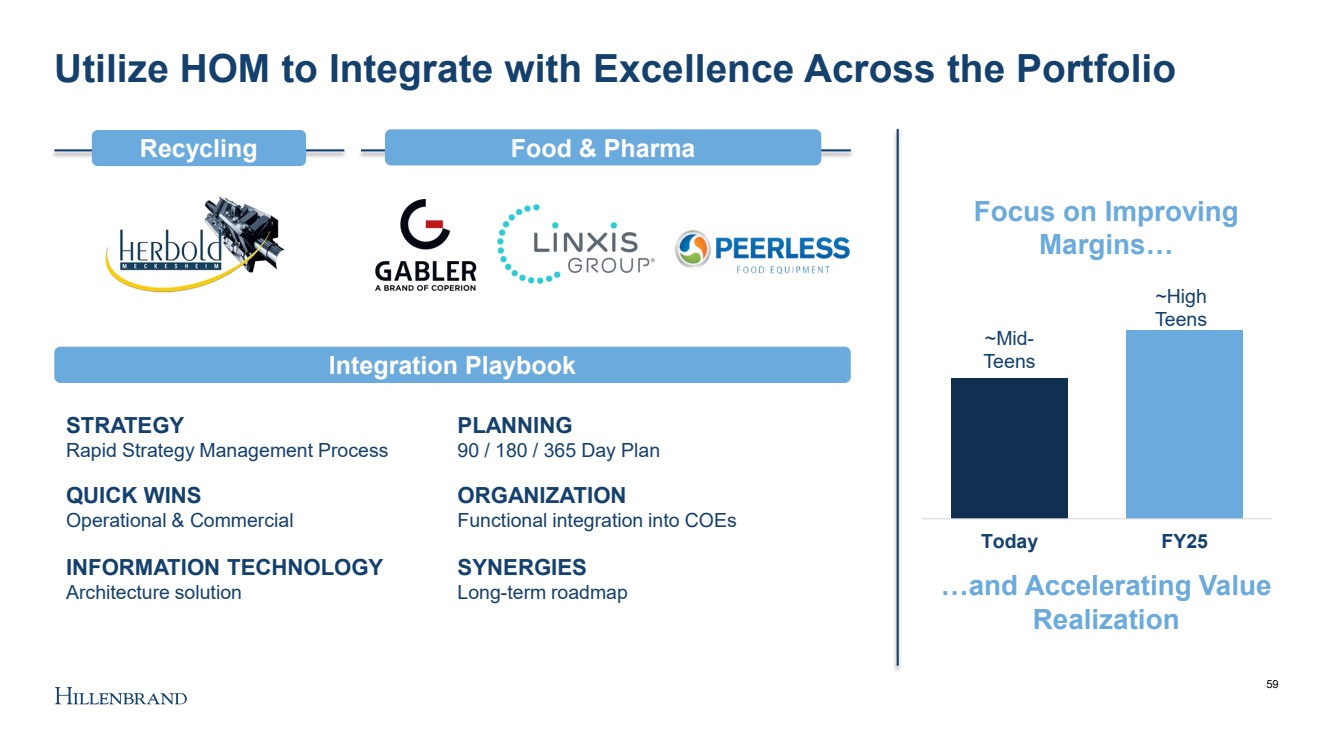
| Utilize HOM to Integrate with Excellence Across the Portfolio ~Mid - Teens ~High Teens Today FY25 59 FOOD, HEALTH & NUTRITION RECYCLING …and Accelerating Value Realization Focus on Improving Margins… STRATEGY Rapid Strategy Management Process PLANNING 90 / 180 / 365 Day Plan QUICK WINS Operational & Commercial ORGANIZATION Functional integration into COEs INFORMATION TECHNOLOGY Architecture solution SYNERGIES Long - term roadmap Recycling Food & Pharma Integration Playbook |
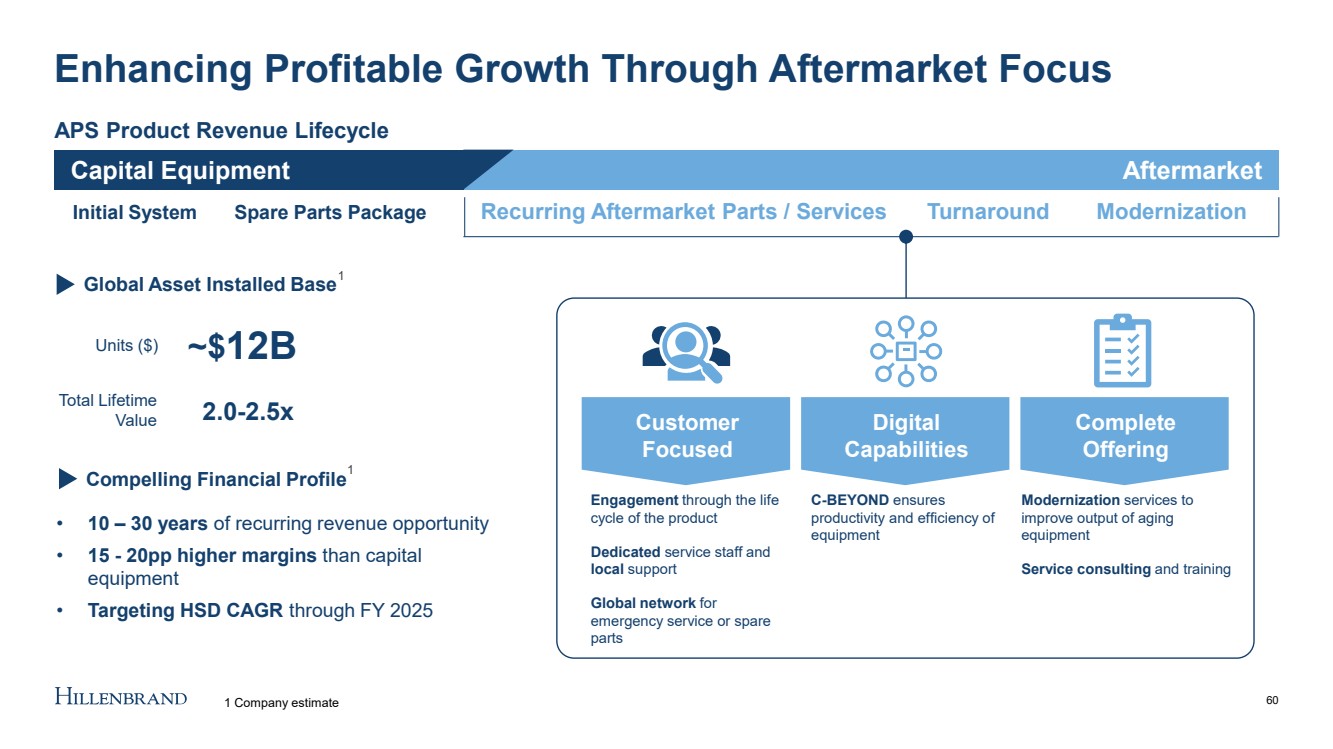
| CUSTOMER’S FIRST CHOICE FOR PARTS & SERVICE AND THE ONE - STOP SHOP ACROSS THE LIFECYCLE APS Product Revenue Lifecycle Capital Equipment Aftermarket • 10 – 30 years of recurring revenue opportunity • 15 - 20pp higher margins than capital equipment • Targeting HSD CAGR through FY 2025 Enhancing Profitable Growth Through Aftermarket Focus Initial System Spare Parts Package Customer Focused Digital Capabilities Complete Offering 60 2.0 - 2.5x Total Lifetime Value Units ($) ~$ 12B Global Asset Installed Base Compelling Financial Profile Recurring Aftermarket Parts / Services Modernization Turnaround Engagement through the life cycle of the product Dedicated service staff and local support Global network for emergency service or spare parts C - BEYOND ensures productivity and efficiency of equipment Modernization services to improve output of aging equipment Service consulting and training 1 1 Company estimate 1 |
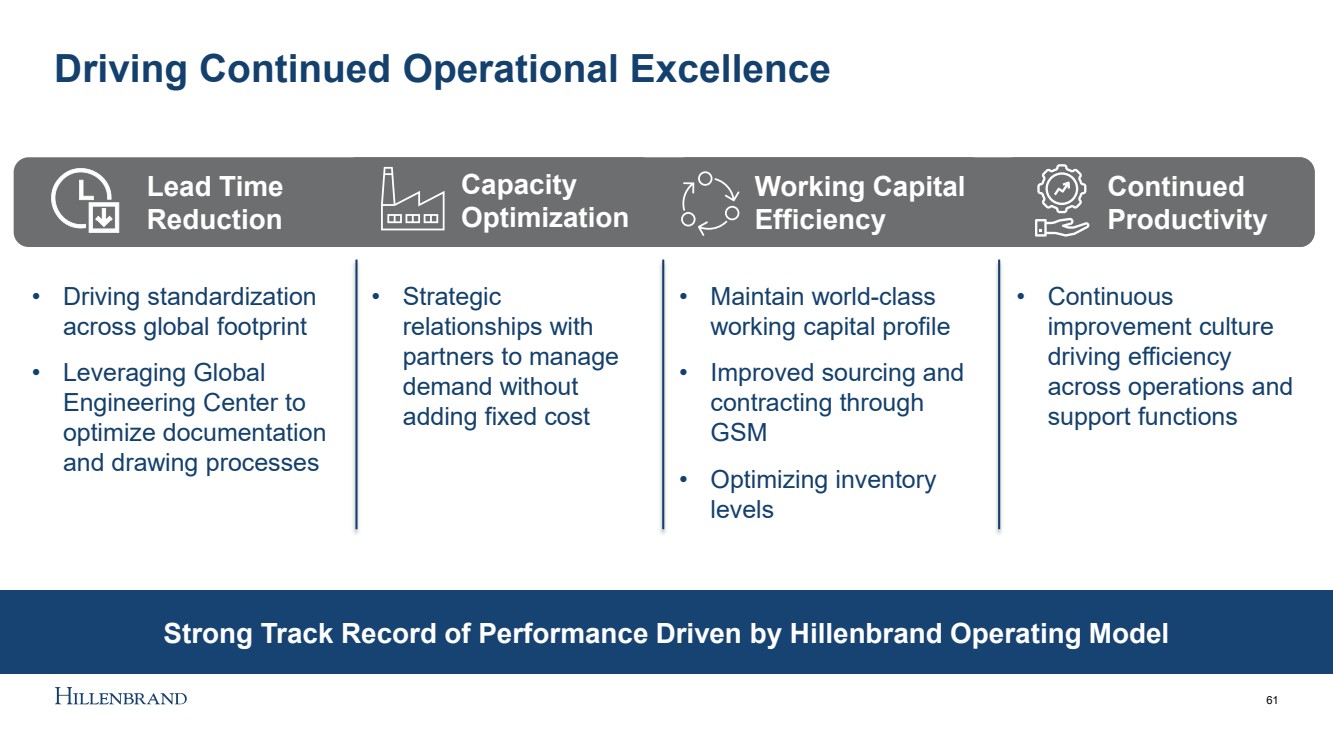
| Driving Continued Operational Excellence • Driving standardization across global footprint • Leveraging Global Engineering Center to optimize documentation and drawing processes • Strategic relationships with partners to manage demand without adding fixed cost • Continuous improvement culture driving efficiency across operations and support functions Strong Track Record of Performance Driven by Hillenbrand Operating Model • Maintain world - class working capital profile • Improved sourcing and contracting through GSM • Optimizing inventory levels 61 Working Capital Efficiency Lead Time Reduction Continued Productivity Capacity Optimization |
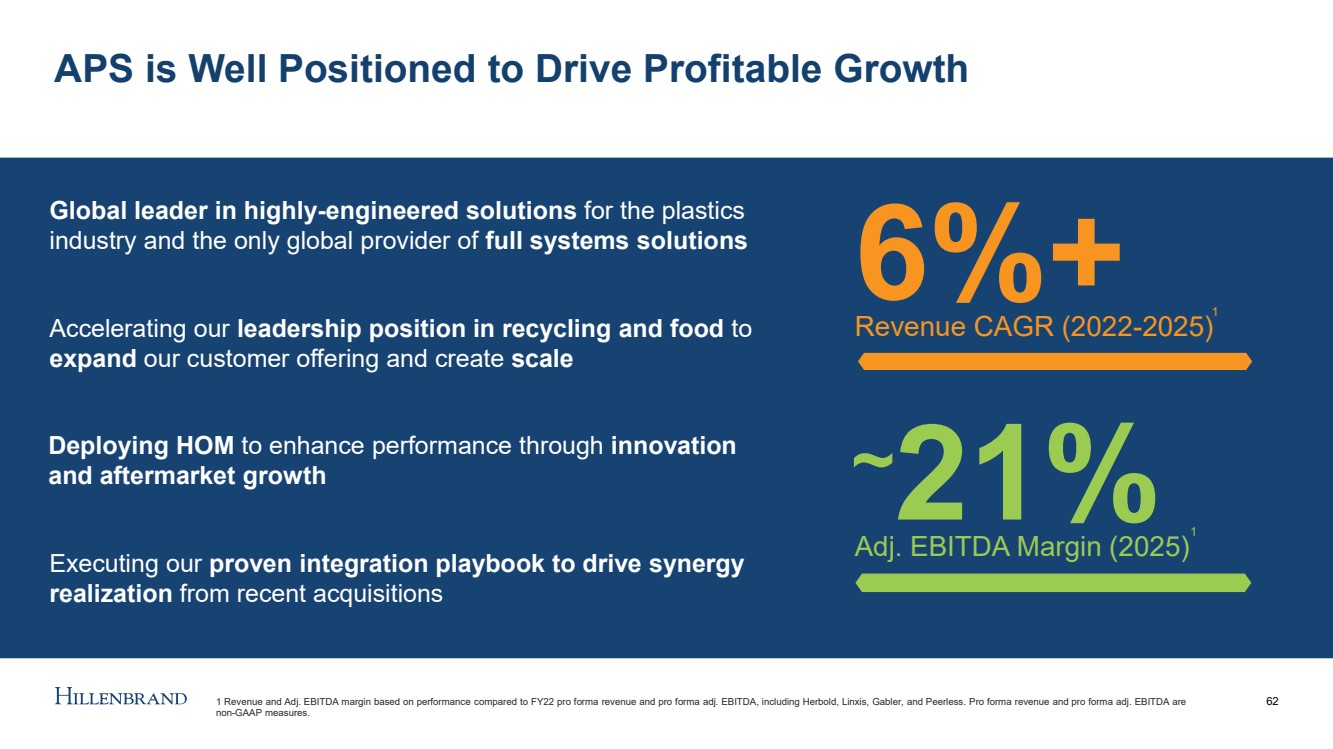
| APS is Well Positioned to Drive Profitable Growth 62 6%+ Revenue CAGR (2022 - 2025) ~ 21% Adj. EBITDA Margin (2025) Global leader in highly - engineered solutions for the plastics industry and the only global provider of full systems solutions Accelerating our leadership position in recycling and food to expand our customer offering and create scale Deploying HOM to enhance performance through innovation and aftermarket growth Executing our proven integration playbook to drive synergy realization from recent acquisitions 1 Revenue and Adj. EBITDA margin based on performance compared to FY22 pro forma revenue and pro forma adj. EBITDA, including Herbold, Linxis , Gabler, and Peerless. Pro forma revenue and pro forma adj. EBITDA are non - GAAP measures. 1 1 |
| 10 - minute break 63 |

| Molding Technology Solutions (MTS) Mac Jones – SVP & President, Milacron 64 |
| 65 65 Global leader in highly - engineered equipment and customized systems, and aftermarket parts and service for the plastics processing industry Differentiated product portfolio offering a full suite of mission - critical technologies Driving profitable growth in aftermarket parts and service through large, global installed base Strengthening our foundation through improved margin and working capital efficiency Focused on innovation to meet evolving demand trends, including sustainability What You’ll Hear Today |
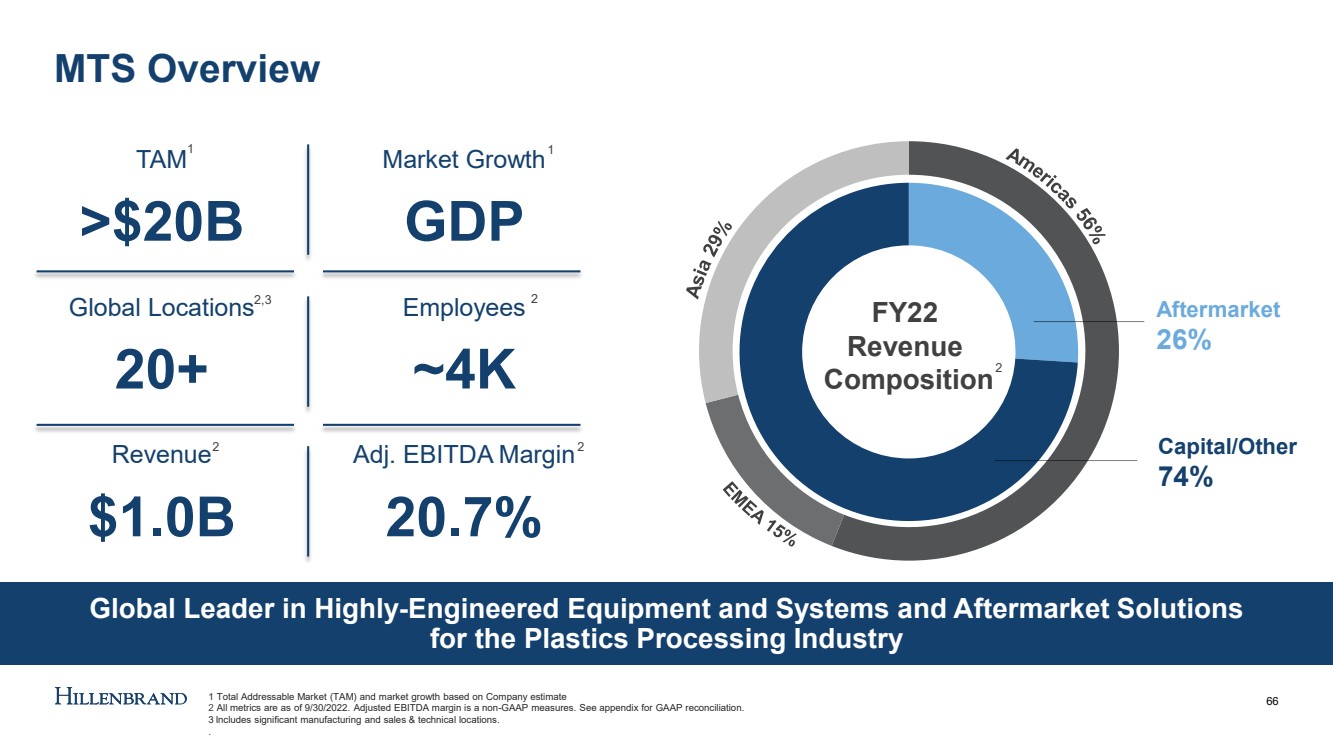
| Global Leader in Highly - Engineered Equipment and Systems and Aftermarket Solutions for the Plastics Processing Industry MTS Overview 66 FY22 Revenue Composition Capital/Other 74% Aftermarket 26% TAM >$20B Market Growth GDP Global Locations 20+ Employees ~4K Revenue $1.0B Adj. EBITDA Margin 20.7% 1 2,3 2 1 Total Addressable Market (TAM) and market growth based on Company estimate 2 All metrics are as of 9/30/2022. Adjusted EBITDA margin is a non - GAAP measures. See appendix for GAAP reconciliation. 3 Includes significant manufacturing and sales & technical locations. .. 2 2 2 1 |
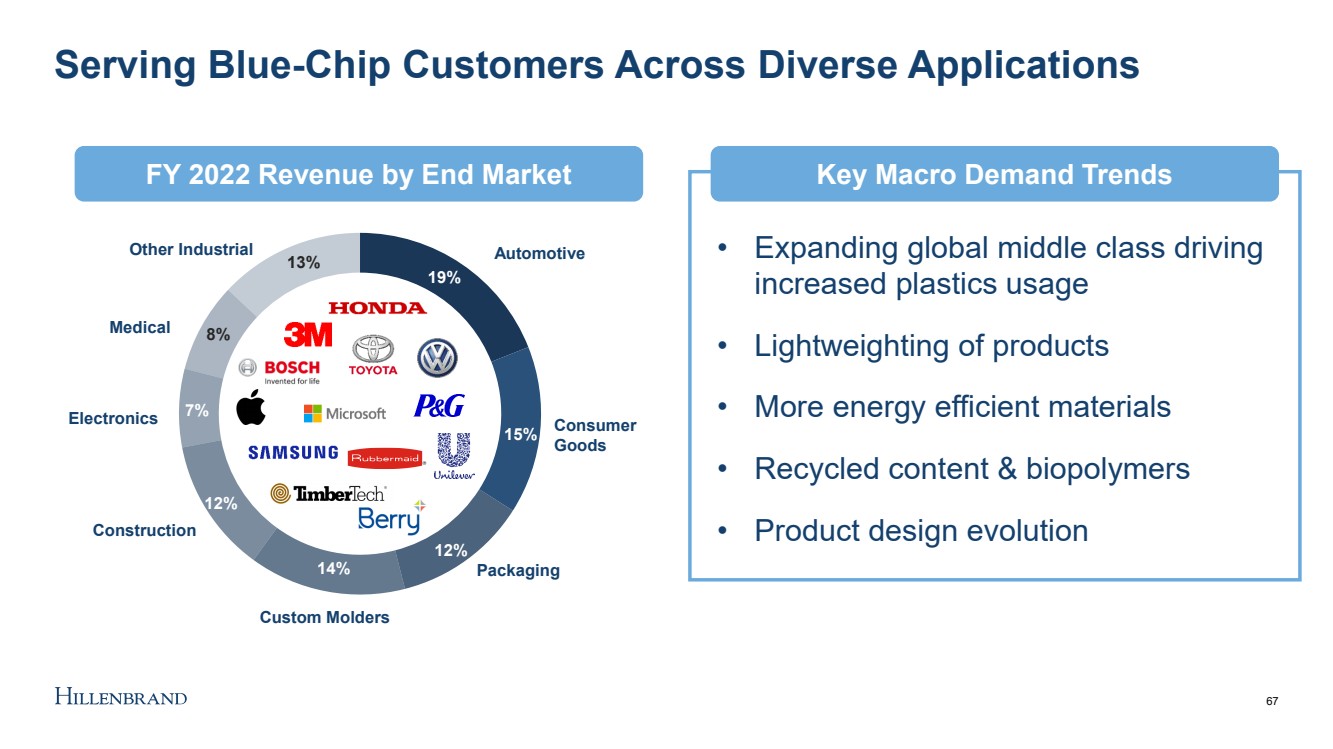
| 19% 15% 12% 14% 12% 7% 8% 13% Key Priorities • Expanding global middle class driving increased plastics usage • Lightweighting of products • More energy efficient materials • Recycled content & biopolymers • Product design evolution Serving Blue - Chip Customers Across Diverse Applications 67 Construction Automotive Custom Molders Medical Electronics Consumer Goods Packaging Other Industrial Key Macro Demand Trends FY 2022 Revenue by End Market |
| Full Suite of Mission - Critical Molding Technologies Through Leading Brands • Parts • Service • Molding Supplies • Digital Aftermarket Solutions: Keeps it Running Equipment Systems: Makes it Possible • Machines • Auxiliaries • Automation IoT & Digital Systems • Molds • Hot Runners • Controls • Mold Bases Molding Systems: Makes it Happen Competitive Advantages Leading technologies and engineering expertise Strong market positions Highly profitable aftermarket offering Long - standing customer relationships Geographic diversification, including established operations in high growth markets |

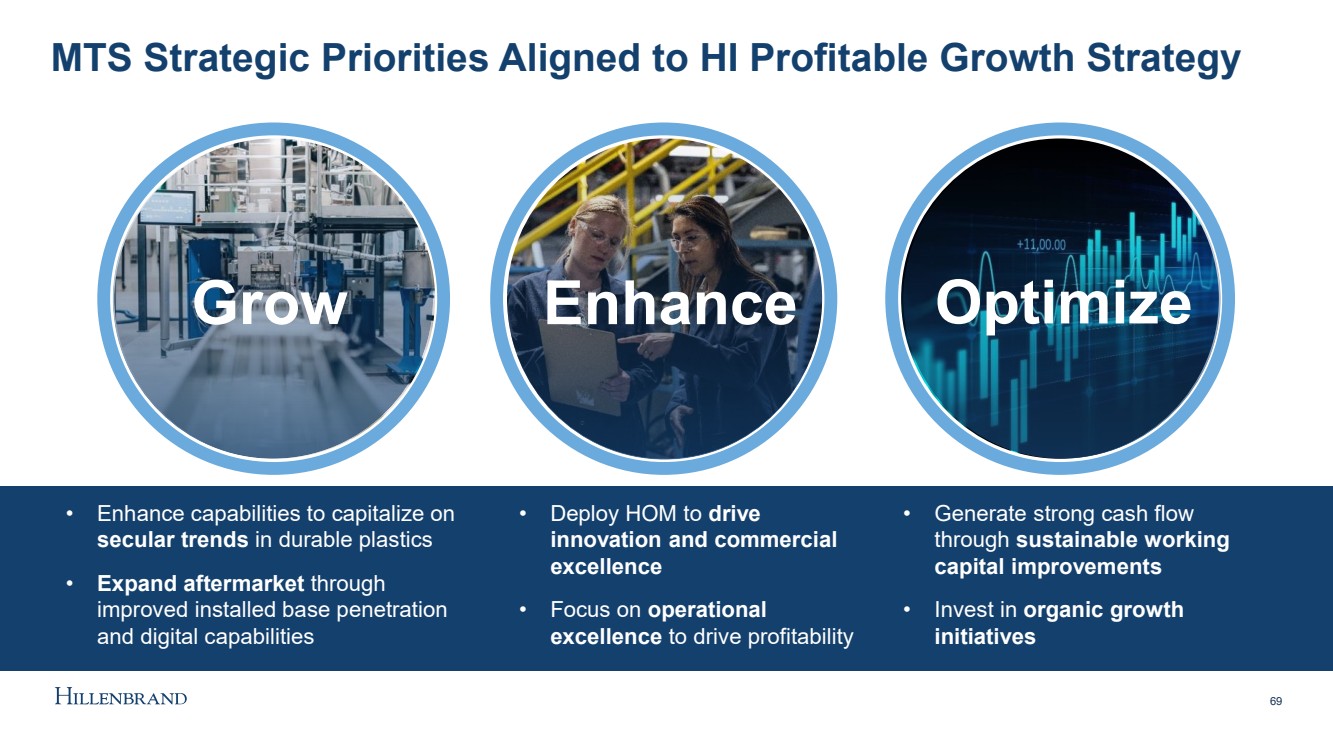
| MTS Strategic Priorities Aligned to HI Profitable Growth Strategy Enhance Optimize 69 Grow • Enhance capabilities to capitalize on secular trends in durable plastics • Expand aftermarket through improved installed base penetration and digital capabilities • Deploy HOM to drive innovation and commercial excellence • Focus on operational excellence to drive profitability • Generate strong cash flow through sustainable working capital improvements • Invest in organic growth initiatives |
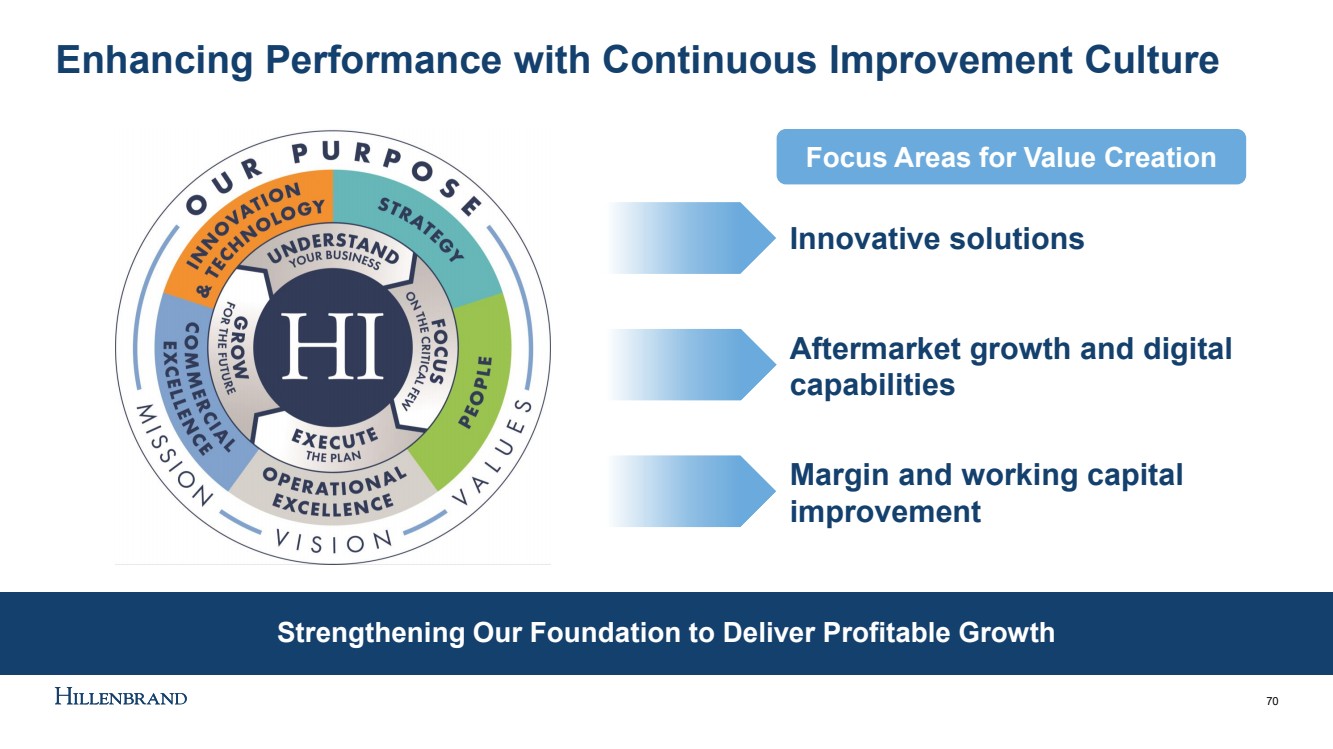
| Strengthening Our Foundation to Deliver Profitable Growth Innovative solutions Enhancing Performance with Continuous Improvement Culture 70 Aftermarket growth and digital capabilities Margin and working capital improvement Focus Areas for Value Creation |
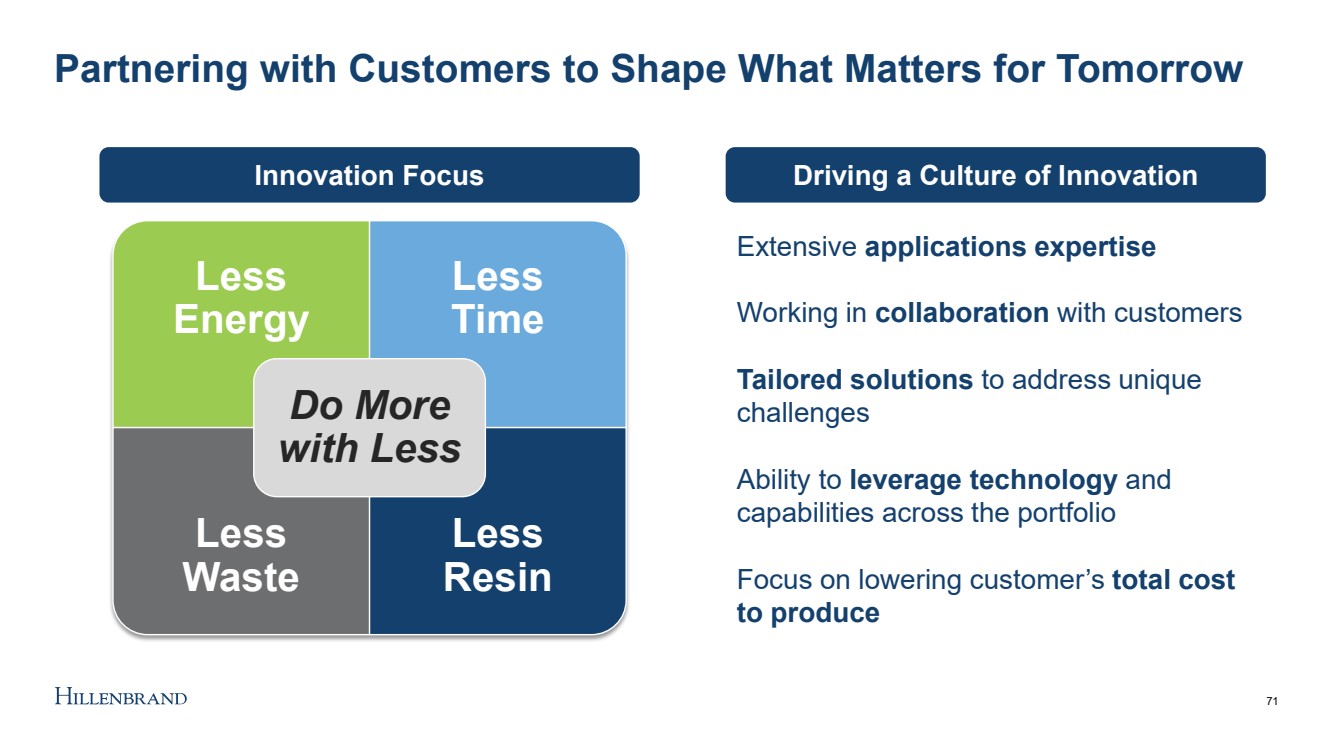
| Partnering with Customers to Shape What Matters for Tomorrow 1 71 Extensive applications expertise Working in collaboration with customers Tailored solutions to address unique challenges Ability to leverage technology and capabilities across the portfolio Focus on lowering customer’s total cost to produce Driving a Culture of Innovation Less Energy Less Time Less Waste Less Resin Do More with Less Innovation Focus |
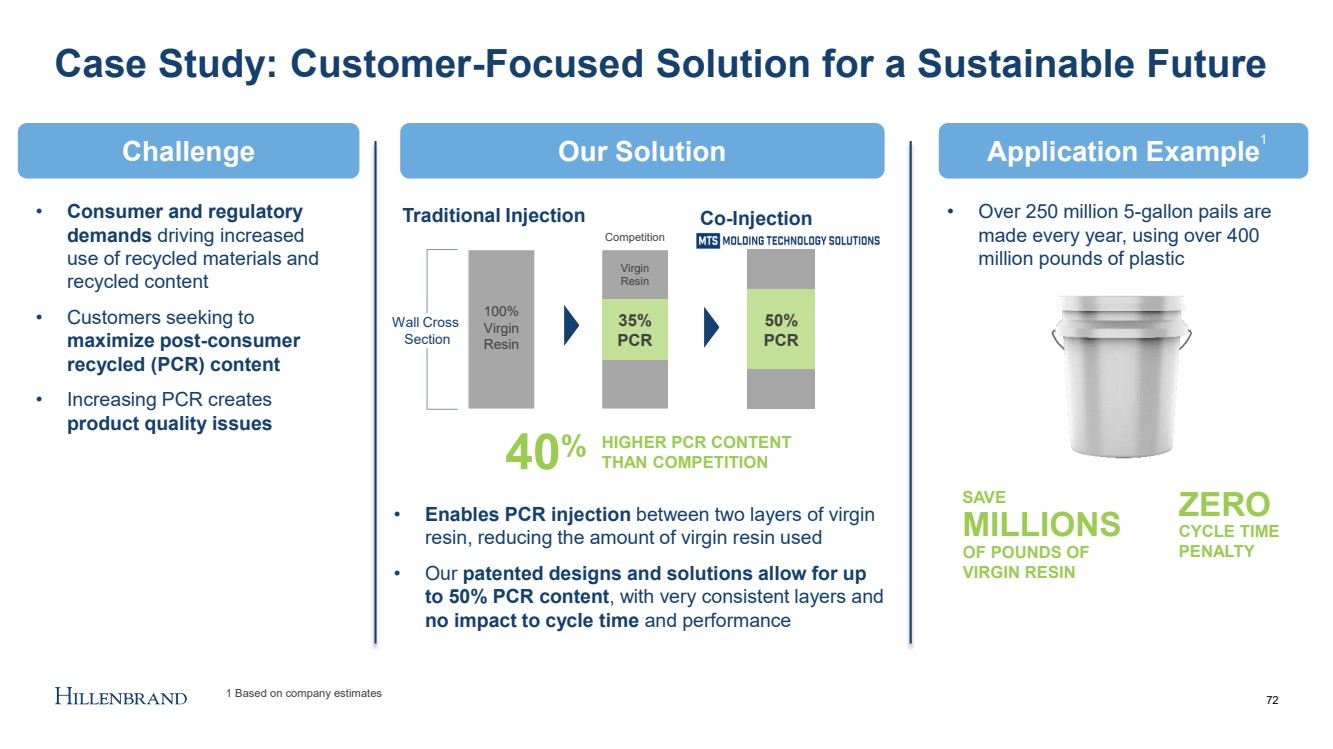
| Case Study: Customer - Focused Solution for a Sustainable Future 100% Virgin Resin 50% PCR Traditional Injection Co - Injection 35% PCR Virgin Resin Competition Wall Cross Section • Enables PCR injection between two layers of virgin resin, reducing the amount of virgin resin used • Our patented designs and solutions allow for up to 50% PCR content , with very consistent layers and no impact to cycle time and performance Opportunity Application Example • Over 250 million 5 - gallon pails are made every year, using over 400 million pounds of plastic ZERO CYCLE TIME PENALTY MILLIONS SAVE OF POUNDS OF VIRGIN RESIN 40 % HIGHER PCR CONTENT THAN COMPETITION • Consumer and regulatory demands driving increased use of recycled materials and recycled content • Customers seeking to maximize post - consumer recycled (PCR) content • Increasing PCR creates product quality issues 1 Based on company estimates 72 Our Solution Application Example Challenge 1 |
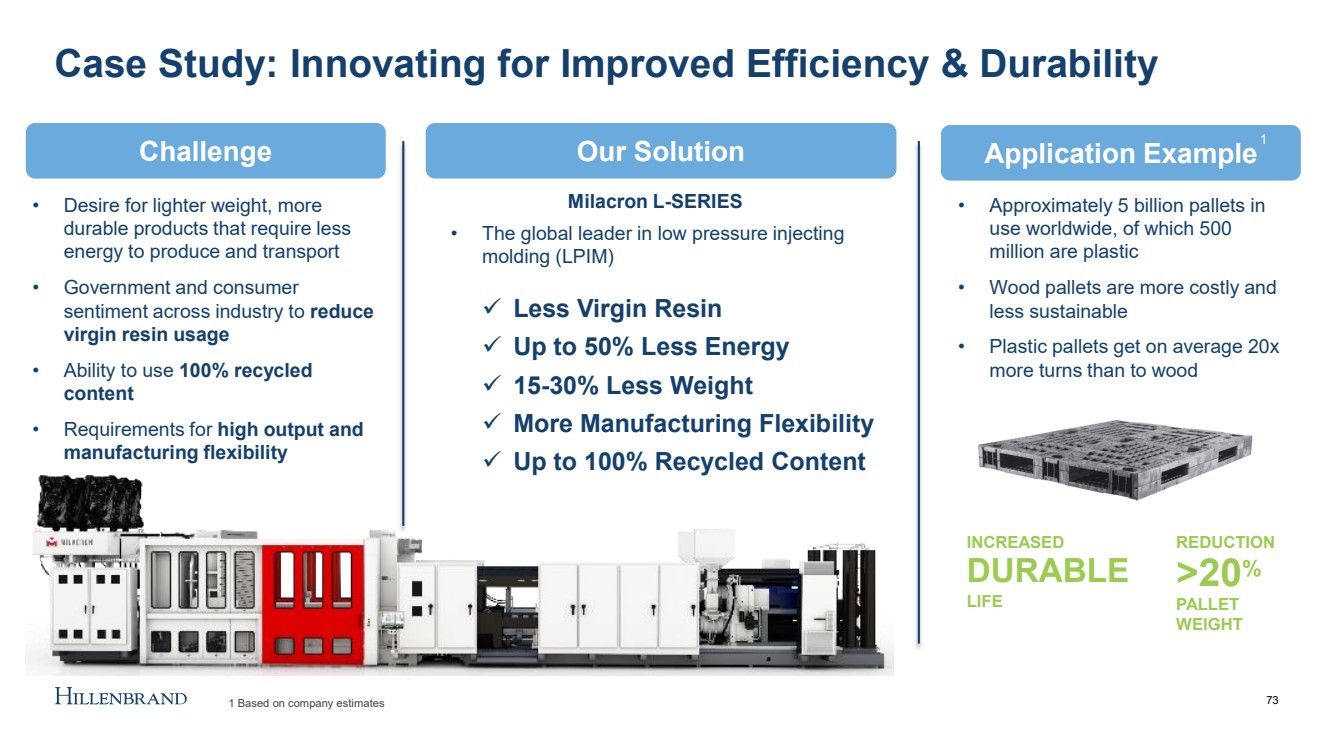
| Case Study: Innovating for Improved Efficiency & Durability Opportunity Application Example 73 Our Solution Application Example Challenge • Desire for lighter weight, more durable products that require less energy to produce and transport • Government and consumer sentiment across industry to reduce virgin resin usage • Ability to use 100% recycled content • Requirements for high output and manufacturing flexibility Milacron L - SERIES • The global leader in low pressure injecting molding (LPIM) • Approximately 5 billion pallets in use worldwide, of which 500 million are plastic • Wood pallets are more costly and less sustainable • Plastic pallets get on average 20x more turns than to wood DURABLE LIFE INCREASED >20 % REDUCTION PALLET WEIGHT ✓ Less Virgin Resin ✓ Up to 50% Less Energy ✓ 15 - 30% Less Weight ✓ More Manufacturing Flexibility ✓ Up to 100% Recycled Content 1 Based on company estimates 1 |
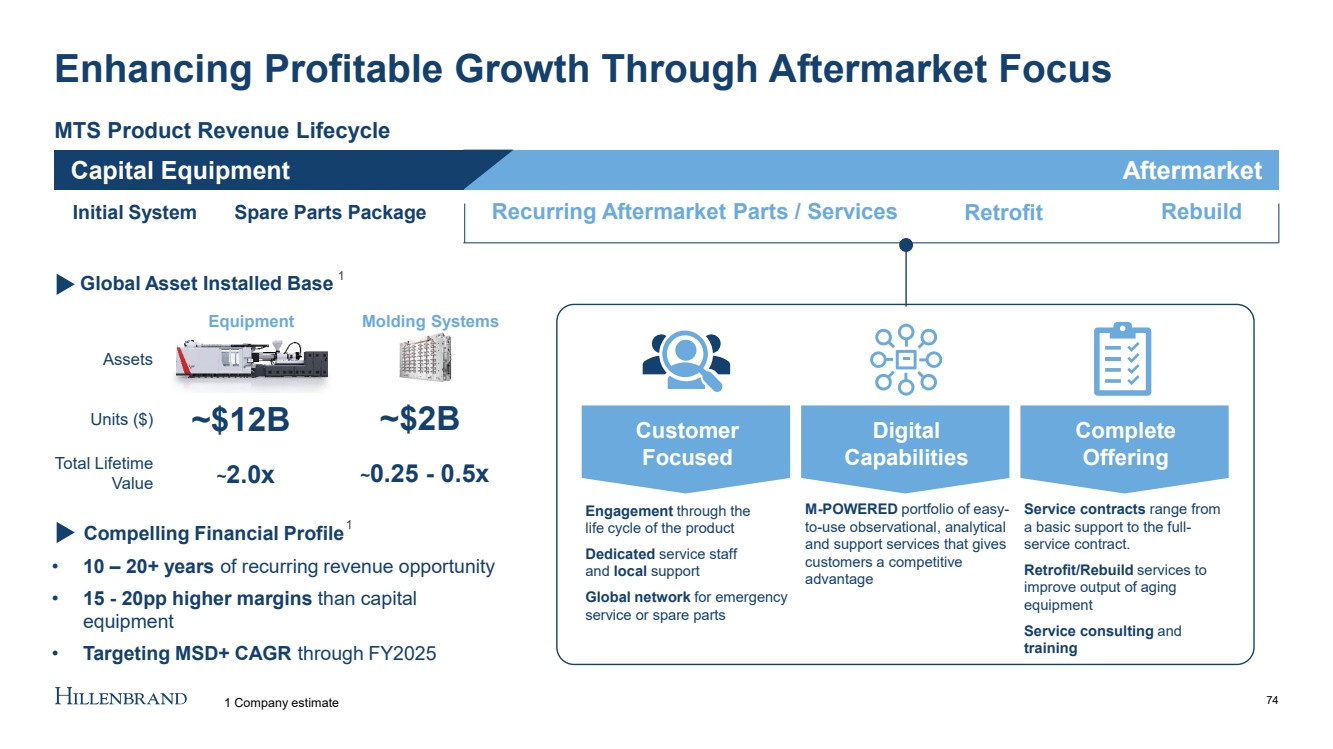
| CUSTOMER’S FIRST CHOICE FOR PARTS & SERVICE AND THE ONE - STOP SHOP ACROSS THE LIFECYCLE MTS Product Revenue Lifecycle Capital Equipment Aftermarket • 10 – 20+ years of recurring revenue opportunity • 15 - 20pp higher margins than capital equipment • Targeting MSD+ CAGR through FY2025 Enhancing Profitable Growth Through Aftermarket Focus Initial System Spare Parts Package Recurring Aftermarket Parts / Services Retrofit Customer Focused Engagement through the life cycle of the product Dedicated service staff and local support Global network for emergency service or spare parts M - POWERED portfolio of easy - to - use observational, analytical and support services that gives customers a competitive advantage Digital Capabilities Service contracts range from a basic support to the full - service contract. Retrofit/Rebuild services to improve output of aging equipment Service consulting and training Complete Offering 74 Rebuild ~ 2.0x ~ 0.25 - 0.5x Total Lifetime Value Assets Equipment Molding Systems Units ($) ~$2B Global Asset Installed Base Compelling Financial Profile 1 1 Company estimate 1 ~$12B |
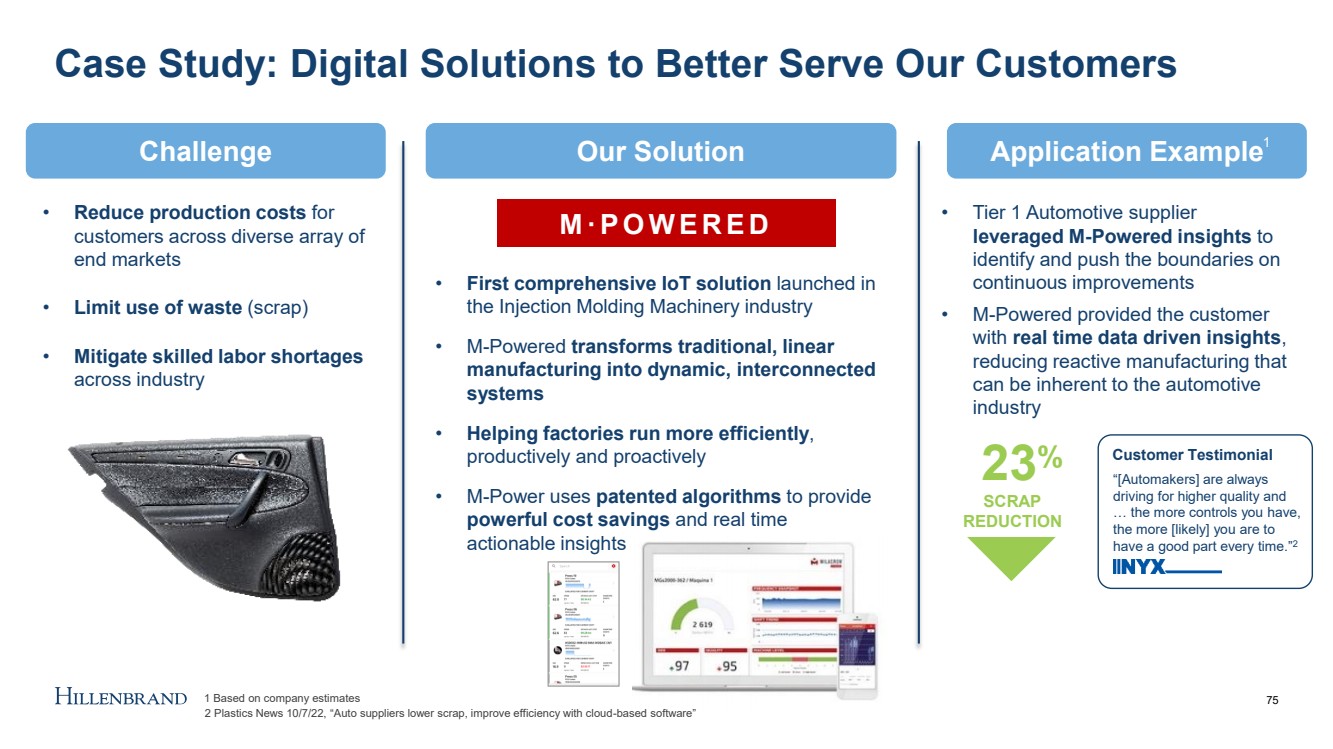
| Case Study: Digital Solutions to Better Serve Our Customers Opportunity Application Example 75 Our Solution Application Example Challenge • Reduce production costs for customers across diverse array of end markets • Limit use of waste (scrap) • Mitigate skilled labor shortages across industry • First comprehensive IoT solution launched in the Injection Molding Machinery industry • M - Powered transforms traditional, linear manufacturing into dynamic, interconnected systems • Helping factories run more efficiently , productively and proactively • M - Power uses patented algorithms to provide powerful cost savings and real time actionable insights M·POWERED • Tier 1 Automotive supplier leveraged M - Powered insights to identify and push the boundaries on continuous improvements • M - Powered provided the customer with real time data driven insights , reducing reactive manufacturing that can be inherent to the automotive industry 23 % SCRAP REDUCTION “[Automakers] are always driving for higher quality and … the more controls you have, the more [likely] you are to have a good part every time.” 2 Customer Testimonial 2 Plastics News 10/7/22, “Auto suppliers lower scrap, improve efficiency with cloud - based software” 1 Based on company estimates 1 |
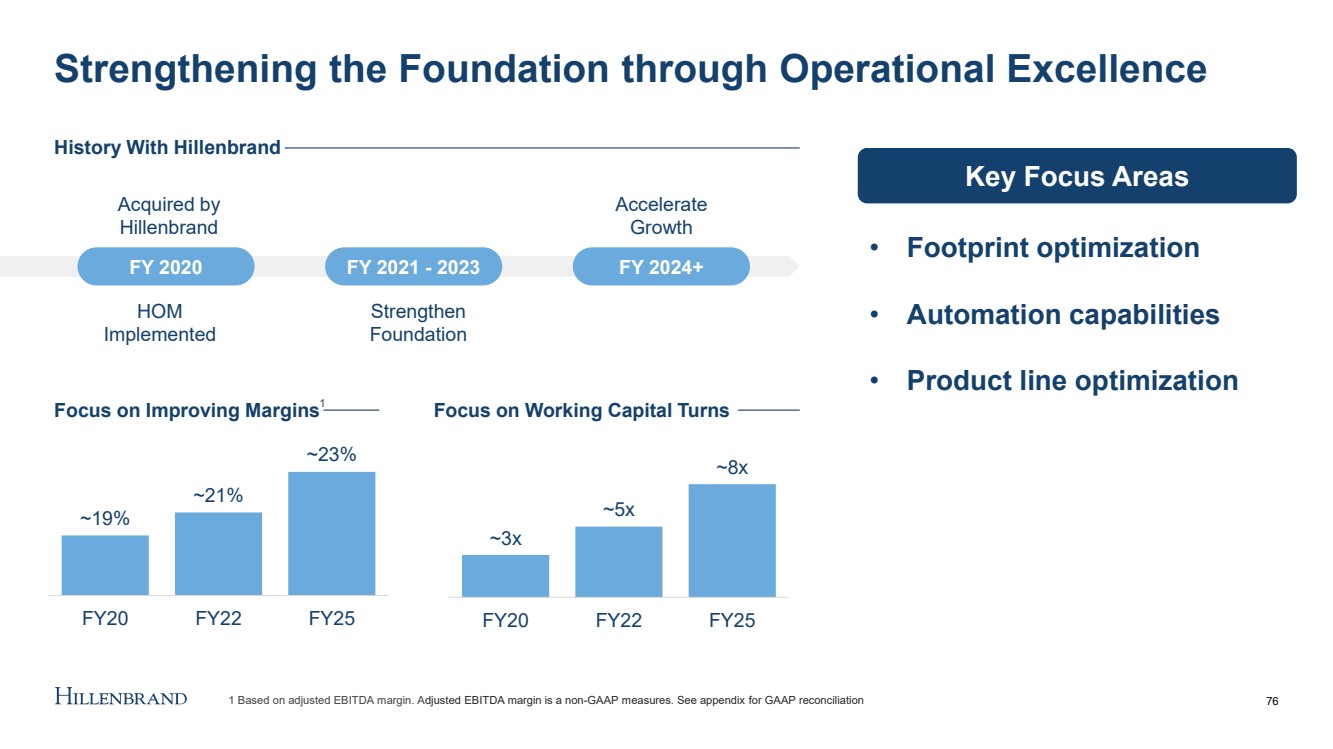
| Strengthening the Foundation through Operational Excellence 76 History With Hillenbrand FY 2020 FY 2021 - 2023 FY 2024+ Acquired by Hillenbrand HOM Implemented Strengthen Foundation Accelerate Growth ~19% ~21% ~23% FY20 FY22 FY25 ~3x ~5x ~8x FY20 FY22 FY25 Focus on Improving Margins Focus on Working Capital Turns • Footprint optimization • Automation capabilities • Product line optimization Key Focus Areas 1 Based on adjusted EBITDA margin. A djusted EBITDA margin is a non - GAAP measures. See appendix for GAAP reconciliation 1 |
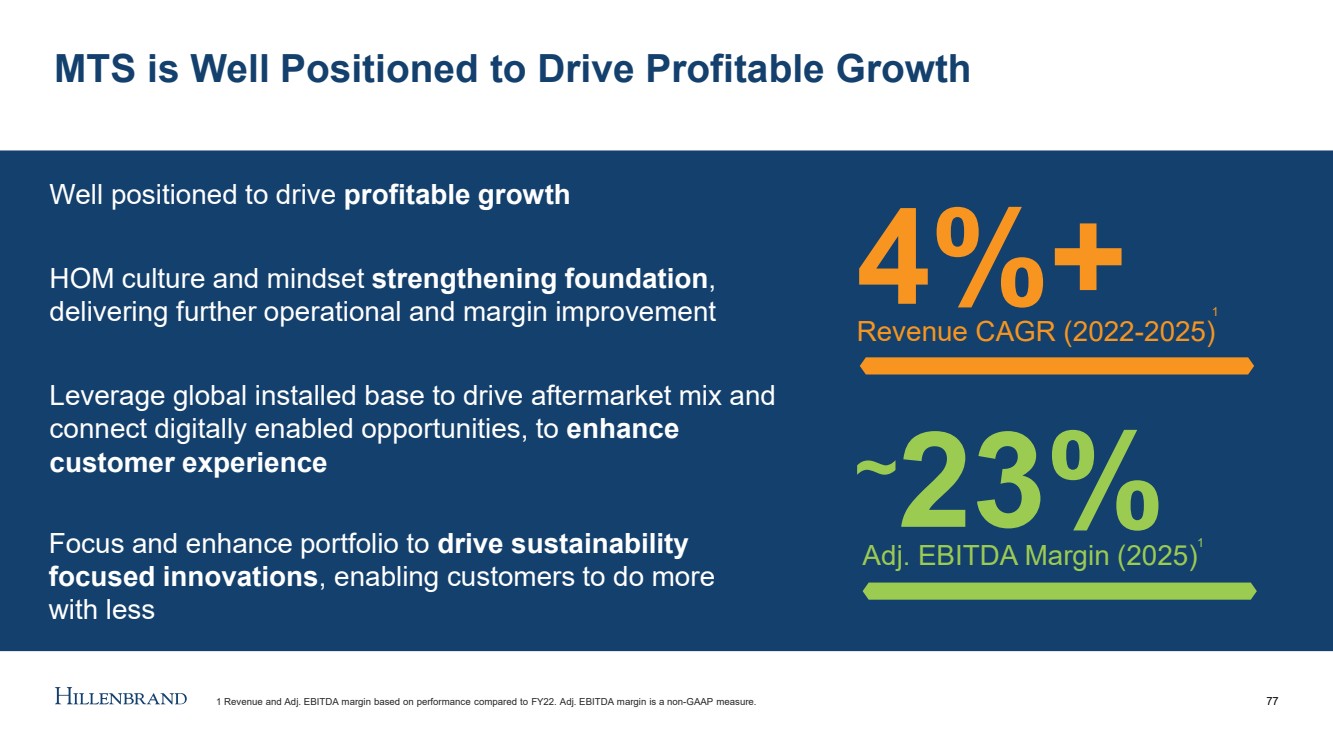
| MTS is Well Positioned to Drive Profitable Growth 77 Focus and enhance portfolio to drive sustainability focused innovations , enabling customers to do more with less Well positioned to drive profitable growth HOM culture and mindset strengthening foundation , delivering further operational and margin improvement Leverage global installed base to drive aftermarket mix and connect digitally enabled opportunities, to enhance customer experience 4%+ Revenue CAGR (2022 - 2025) ~ 23% Adj. EBITDA Margin (2025) 1 1 1 Revenue and Adj. EBITDA margin based on performance compared to FY22. Adj. EBITDA margin is a non - GAAP measure. |
| Sustainability Tory Flynn – Chief Sustainability Officer 78 |

| 79 What You’ll Hear Today Global trends create opportunity for Hillenbrand to drive value through our people, our products, and our partnerships Sustainability is integrated into how we run the business through the Hillenbrand Operating Model We continue to increase transparency and accountability, while driving results across the organization |
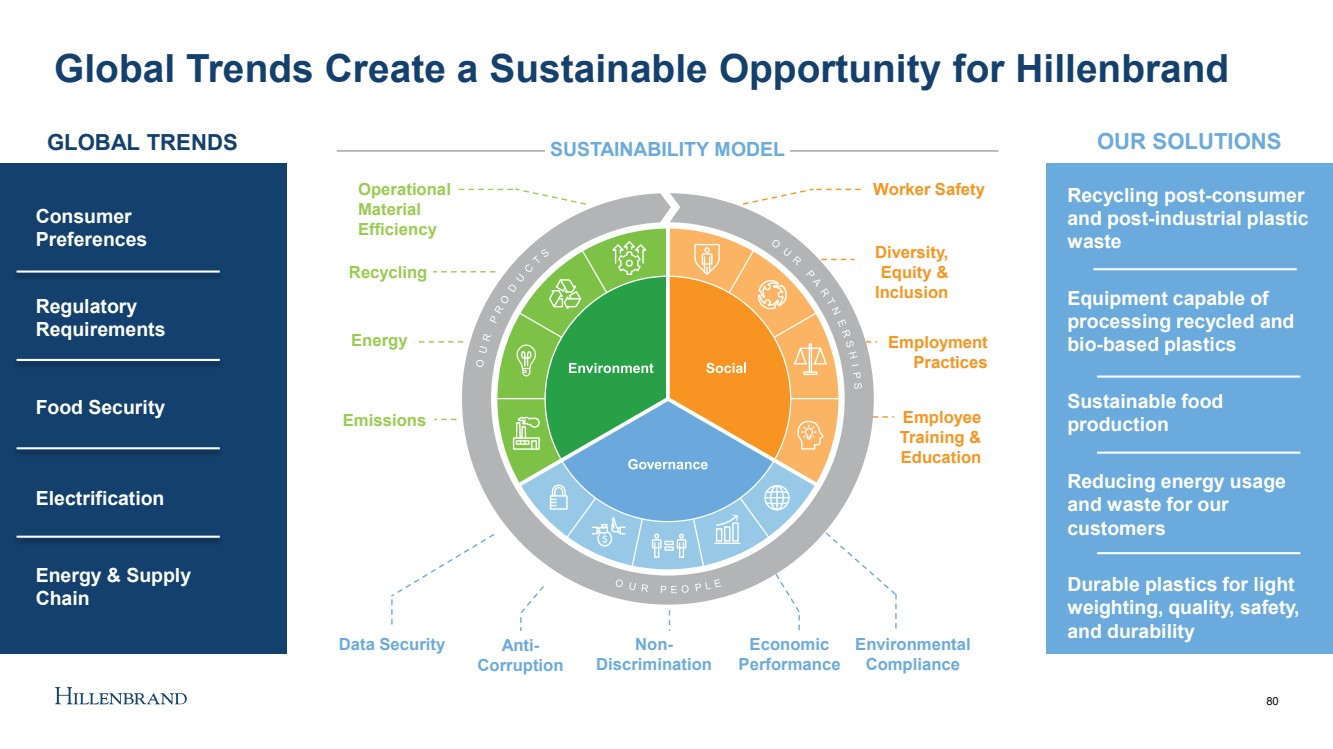
| Global Trends Create a Sustainable Opportunity for Hillenbrand 80 Consumer Preferences Data Security Anti - Corruption Non - Discrimination Economic Performance Environmental Compliance Worker Safety Diversity, Equity & Inclusion Employment Practices Employee Training & Education Operational Material Efficiency Recycling Energy Emissions SUSTAINABILITY MODEL Regulatory Requirements Food Security Electrification Energy & Supply Chain OUR SOLUTIONS Recycling post - consumer and post - industrial plastic waste Equipment capable of processing recycled and bio - based plastics Sustainable food production Reducing energy usage and waste for our customers Durable plastics for light weighting, quality, safety, and durability GLOBAL TRENDS |
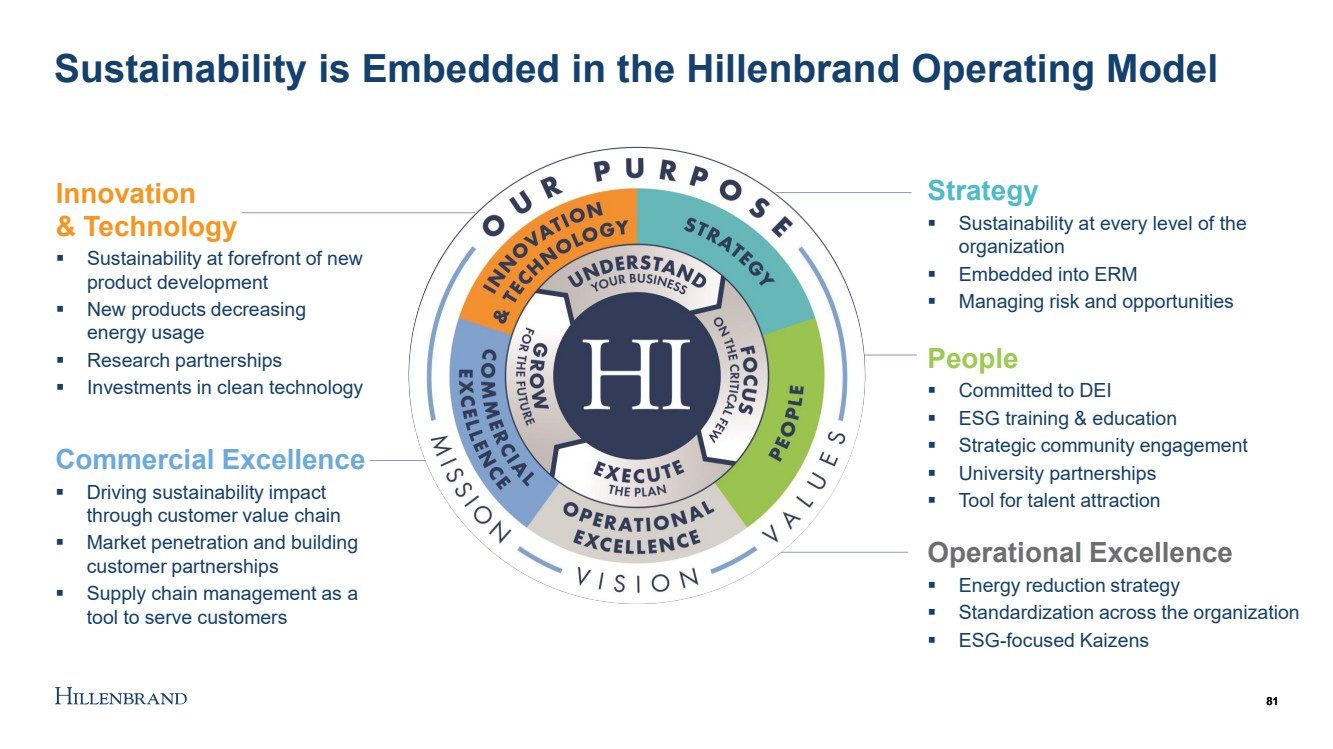
| Sustainability is Embedded in the Hillenbrand Operating Model Strategy ▪ Sustainability at every level of the organization ▪ Embedded into ERM ▪ Managing risk and opportunities People ▪ Committed to DEI ▪ ESG training & education ▪ Strategic community engagement ▪ University partnerships ▪ Tool for talent attraction Operational Excellence ▪ Energy reduction strategy ▪ Standardization across the organization ▪ ESG - focused Kaizens Innovation & Technology ▪ Sustainability at forefront of new product development ▪ New products decreasing energy usage ▪ Research partnerships ▪ Investments in clean technology Commercial Excellence ▪ Driving sustainability impact through customer value chain ▪ Market penetration and building customer partnerships ▪ Supply chain management as a tool to serve customers 81 81 |
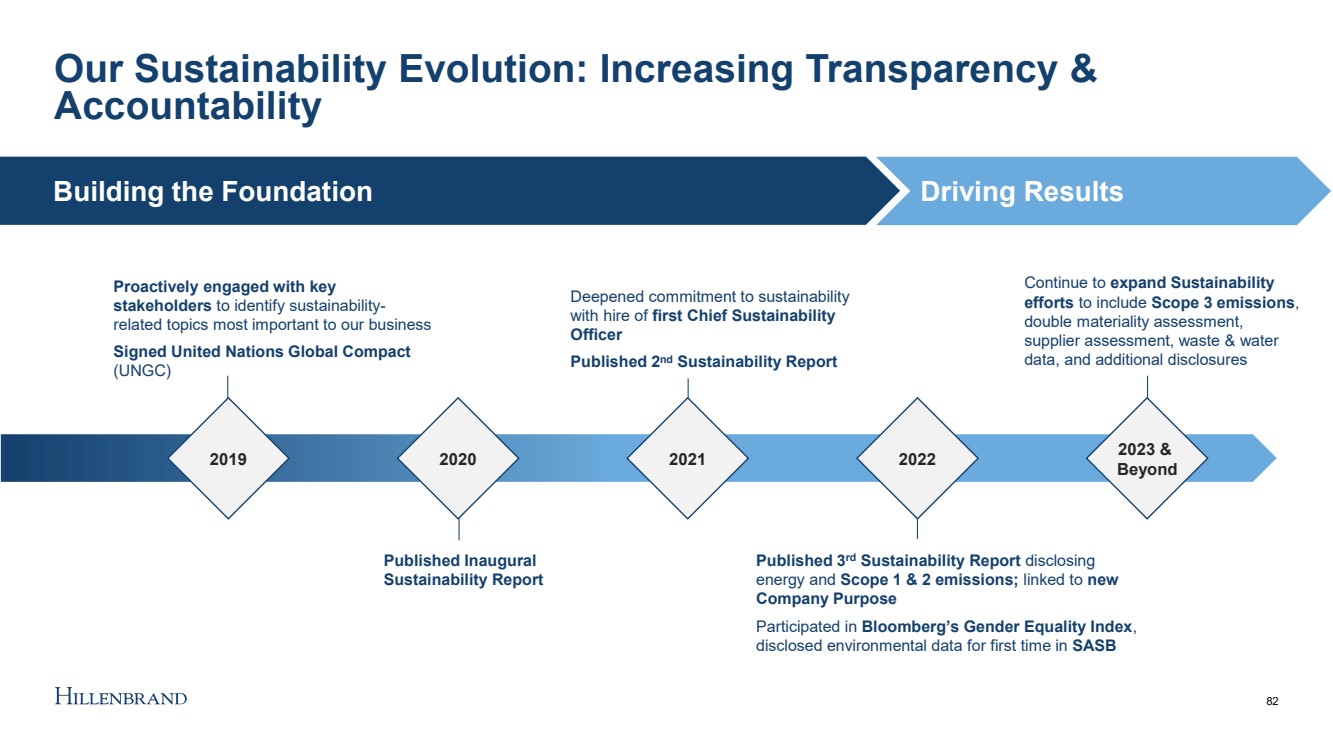
| 82 Our Sustainability Evolution: Increasing Transparency & Accountability 2019 2020 2021 2022 2023 & Beyond Proactively engaged with key stakeholders to identify sustainability - related topics most important to our business Signed United Nations Global Compact (UNGC) Deepened commitment to sustainability with hire of first Chief Sustainability Officer Published 2 nd Sustainability Report Continue to expand Sustainability efforts to include Scope 3 emissions , double materiality assessment, supplier assessment, waste & water data, and additional disclosures Published Inaugural Sustainability Report Published 3 rd Sustainability Report disclosing energy and Scope 1 & 2 emissions; linked to new Company Purpose Participated in Bloomberg’s Gender Equality Index , disclosed environmental data for first time in SASB Building the Foundation Driving Results |
| Purpose - driven Culture Driving Greater Engagement Through Our People 83 DRIVING RESULTS THROUGH KEY INITIATIVES • Engaging our Employees through a Greater Purpose • CEO Diversity Commitment • Business Resource Groups • Standardization of Health & Safety • Improve DEI Results, Transparency & Reporting • Associate Sustainability Training |
| Constantly Innovating to Deliver New Customer Solutions Through Our Products 84 DRIVING RESULTS THROUGH KEY INITIATIVES • Material Alternatives • Tailored Solutions • Research Partnerships • Innovation Investment • Investments in Technology to Support Sustainability • Clean Technology |
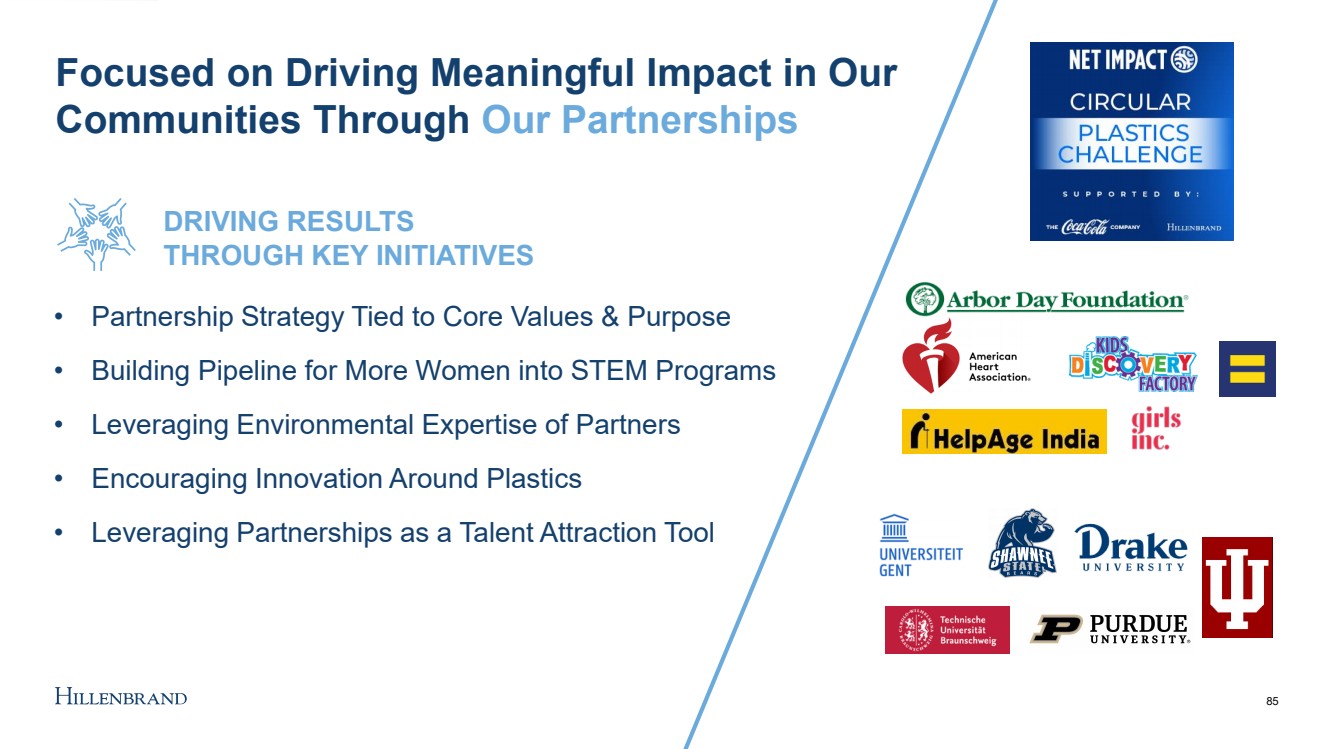
| 85 Focused on Driving Meaningful Impact in Our Communities Through Our Partnerships DRIVING RESULTS THROUGH KEY INITIATIVES • Partnership Strategy Tied to Core Values & Purpose • Building Pipeline for More Women into STEM Programs • Leveraging Environmental Expertise of Partners • Encouraging Innovation Around Plastics • Leveraging Partnerships as a Talent Attraction Tool |
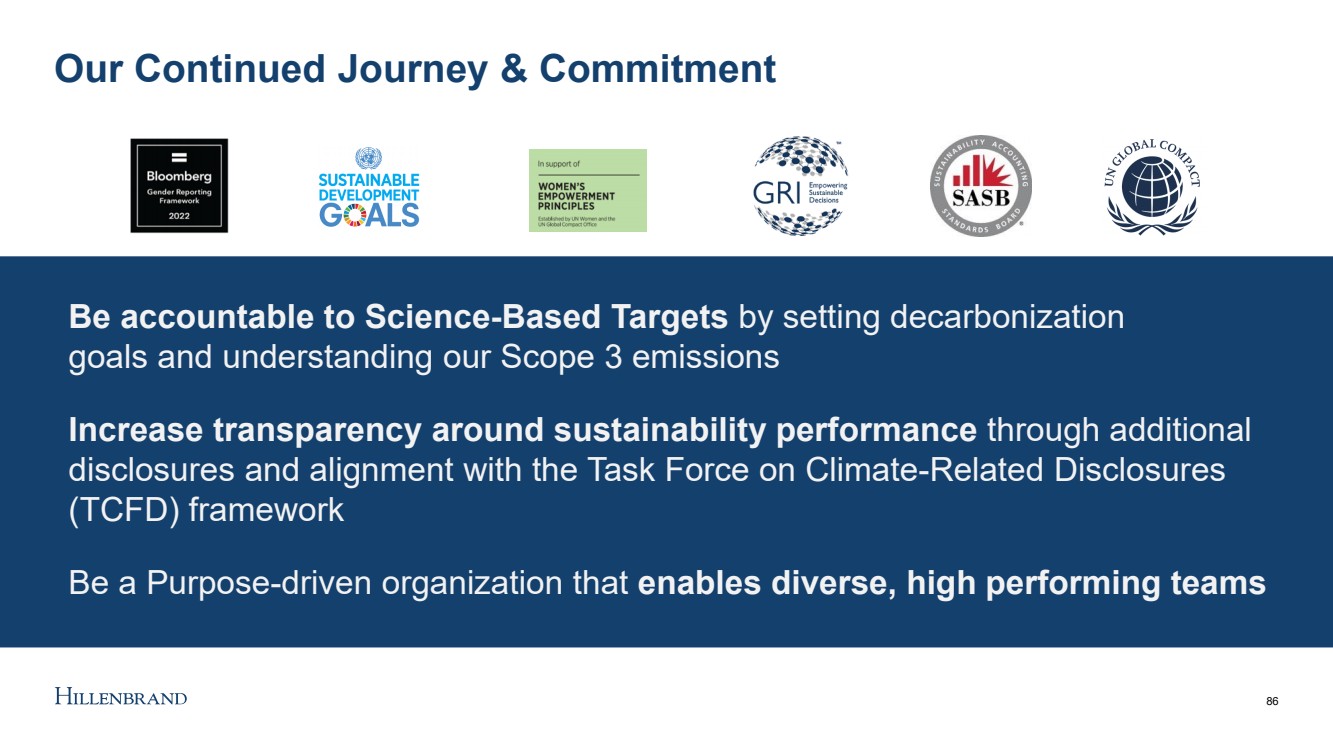
| Our Continued Journey & Commitment 86 Be accountable to Science - Based Targets by setting decarbonization goals and understanding our Scope 3 emissions Increase transparency around sustainability performance through additional disclosures and alignment with the Task Force on Climate - Related Disclosures (TCFD) framework Be a Purpose - driven organization that enables diverse, high performing teams |
| 87 Key Takeaways Global trends create opportunity for Hillenbrand to drive value through our people, our products, and our partnerships Sustainability is integrated into how we run the business through the Hillenbrand Operating Model We continue to increase transparency and accountability, while driving results across the organization |
| Financial Overview & Outlook Bob VanHimbergen – SVP & Chief Financial Officer 88 |

| 89 89 Proven track record of performance enabled by the Hillenbrand Operating Model which drives our culture of continuous improvement Well positioned for long - term growth in attractive, growing end markets supporting our 2025 performance targets Disciplined capital allocation to maximize long - term shareholder value What You’ll Hear Today Record backlog provides confidence and visibility as we operate through continued macro uncertainty |
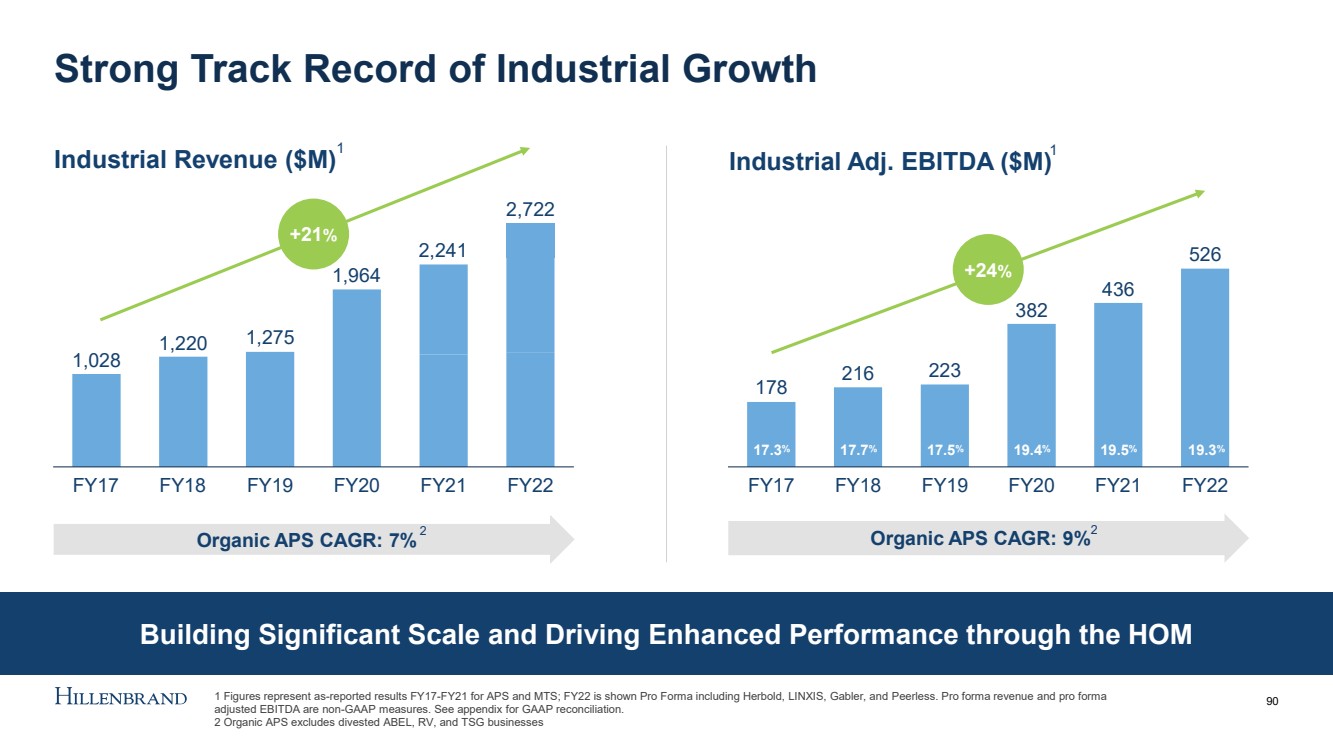
| Building Significant Scale and Driving Enhanced Performance through the HOM Strong Track Record of Industrial Growth 90 Industrial Revenue ($M) Industrial Adj. EBITDA ($M) 1,028 1,220 1,275 FY17 2,241 1,964 FY20 FY21 FY22 2,722 FY18 FY19 +21 % Organic APS CAGR: 7% 178 216 223 382 436 526 FY17 FY18 FY21 FY19 FY20 FY22 +24 % Organic APS CAGR: 9% 1 Figures represent as - reported results FY17 - FY21 for APS and MTS; FY22 is shown Pro Forma including Herbold, LINXIS, Gabler, an d Peerless. Pro forma revenue and pro forma adjusted EBITDA are non - GAAP measures. See appendix for GAAP reconciliation. 2 Organic APS excludes divested ABEL, RV, and TSG businesses 17.3 % 17.7 % 17.5 % 19.4 % 19.5 % 19.3 % 1 1 2 2 |
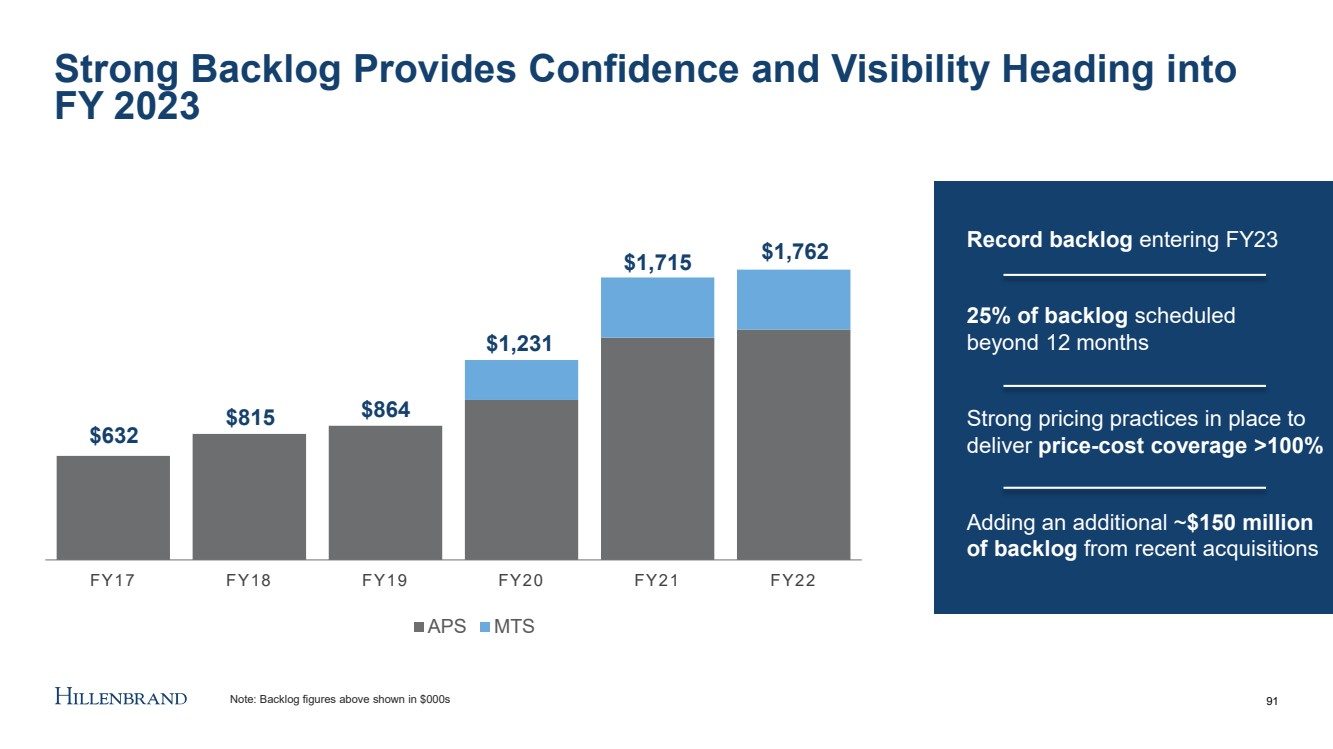
| FY17 FY18 FY19 FY20 FY21 FY22 APS MTS $632 $815 $864 $1,231 $1,715 $1,762 Strong Backlog Provides Confidence and Visibility Heading into FY 2023 91 Record backlog entering FY23 25% of backlog scheduled beyond 12 months Strong pricing practices in place to deliver price - cost coverage >100% Adding an additional ~ $150 million of backlog from recent acquisitions Note: Backlog figures above shown in $000s |
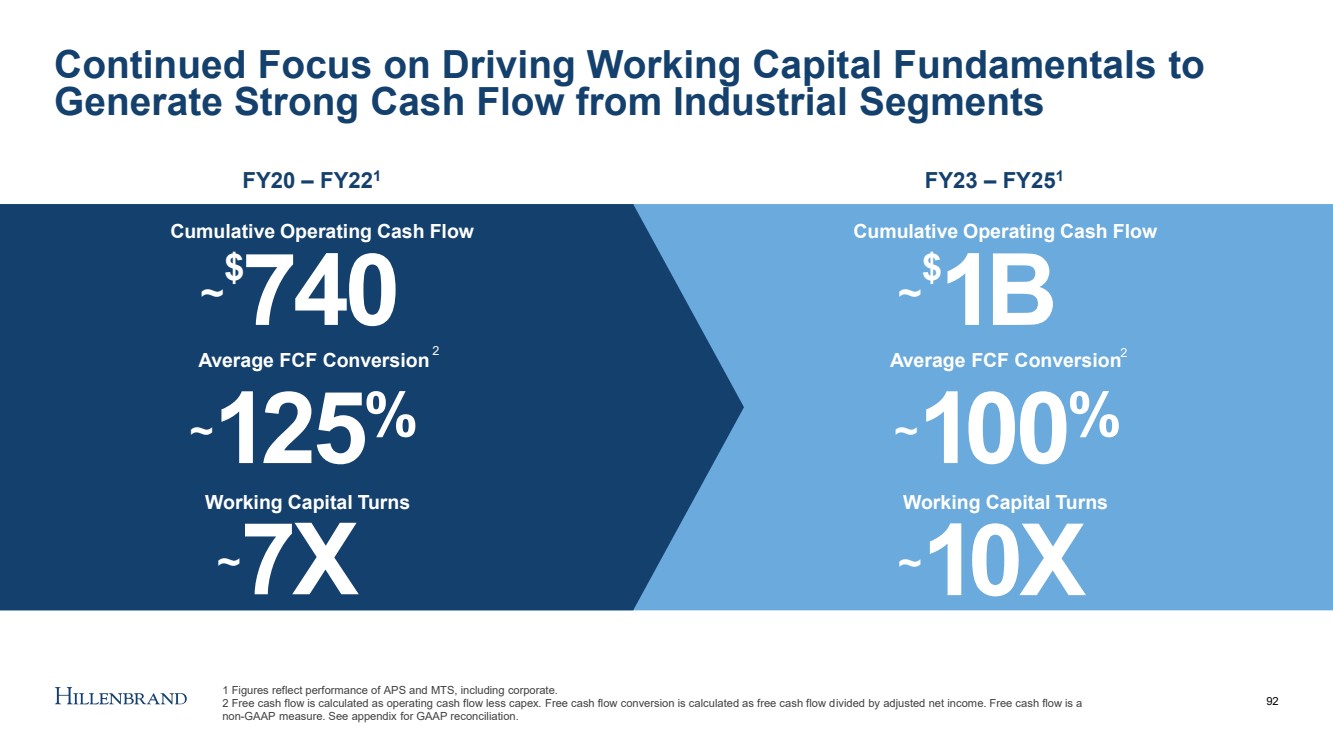
| Continued Focus on Driving Working Capital Fundamentals to Generate Strong Cash Flow from Industrial Segments 92 FY20 – FY22 1 FY23 – FY25 1 ~ $ 740 ~ 1 25 % ~ 7X Cumulative Operating Cash Flow Average FCF Conversion Working Capital Turns ~ $ 1 B ~ 1 00 % ~ 1 0X Cumulative Operating Cash Flow Average FCF Conversion Working Capital Turns 2 2 1 Figures reflect performance of APS and MTS, including corporate. 2 Free cash flow is calculated as operating cash flow less capex. Free cash flow conversion is calculated as free cash flow d ivi ded by adjusted net income. Free cash flow is a non - GAAP measure. See appendix for GAAP reconciliation. |
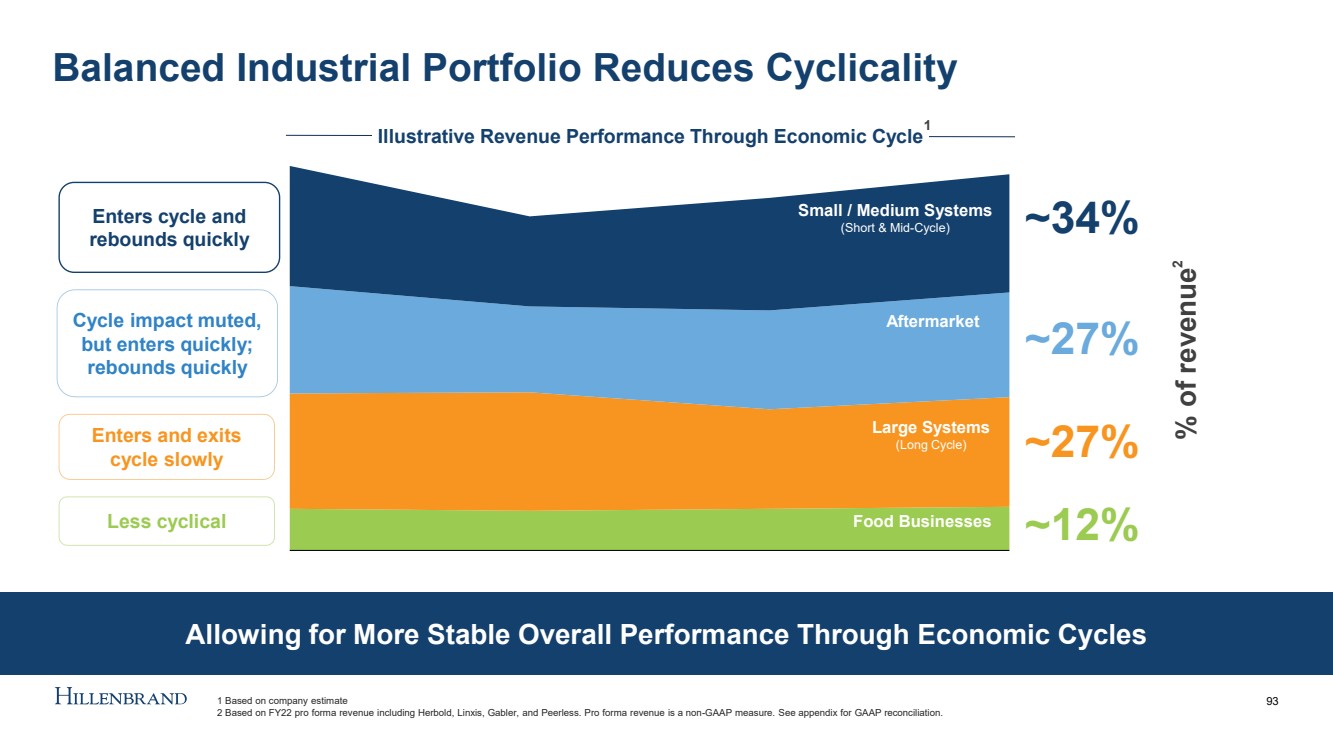
| Allowing for More Stable Overall Performance Through Economic Cycles Balanced Industrial Portfolio Reduces Cyclicality 93 Enters cycle and rebounds quickly Cycle impact muted, but enters quickly; rebounds quickly Enters and exits cycle slowly Less cyclical (Short & Mid - Cycle) (Long - Cycle) Food Businesses Large Systems (Long Cycle) Aftermarket Small / Medium Systems (Short & Mid - Cycle) Illustrative Revenue Performance Through Economic Cycle ~34% ~27% ~27% ~12% % of revenue 1 Based on company estimate 2 Based on FY22 pro forma revenue including Herbold, Linxis , Gabler, and Peerless. Pro forma revenue is a non - GAAP measure. See appendix for GAAP reconciliation. 1 2 |
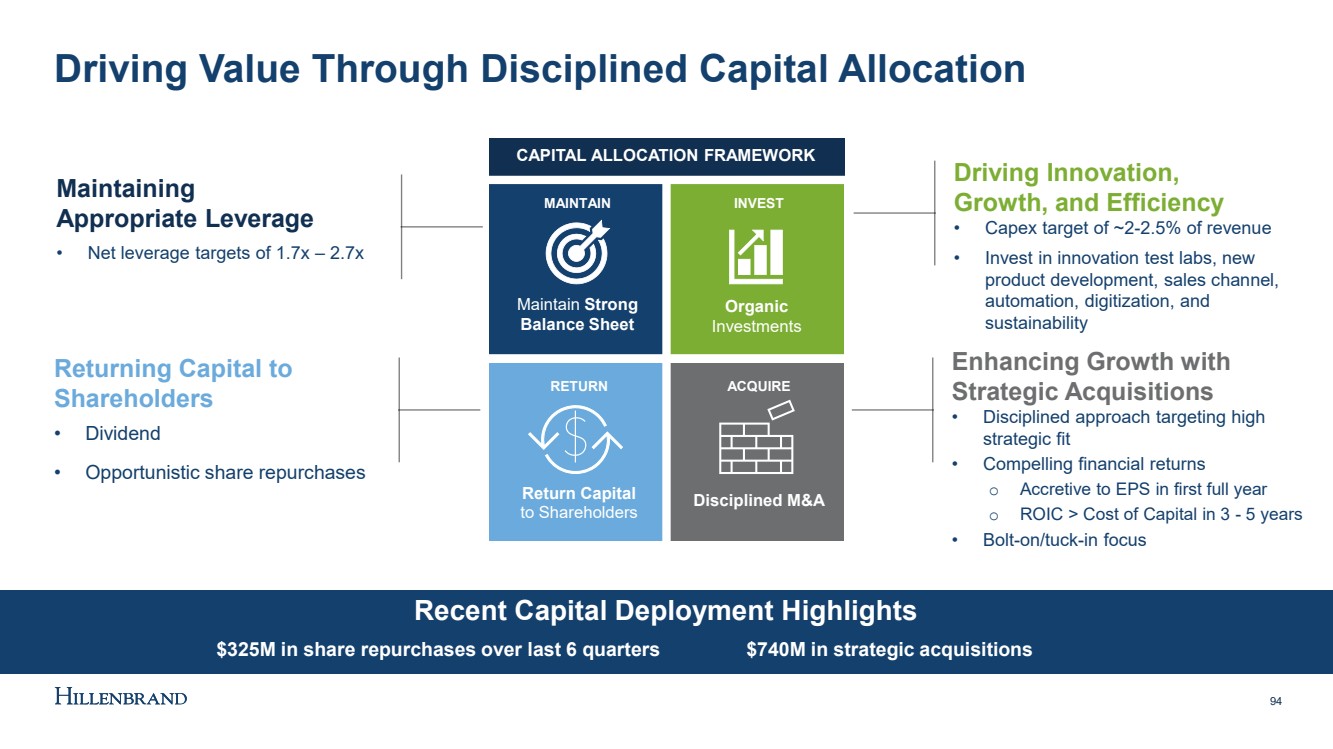
| Driving Value Through Disciplined Capital Allocation 94 Returning Capital to Shareholders • Dividend • Opportunistic share repurchases Enhancing Growth with Strategic Acquisitions • Disciplined approach targeting high strategic fit • Compelling financial returns o Accretive to EPS in first full year o ROIC > Cost of Capital in 3 - 5 years • Bolt - on/tuck - in focus Driving Innovation, Growth, and Efficiency • Capex target of ~2 - 2.5% of revenue • Invest in innovation test labs, new product development, sales channel, automation, digitization, and sustainability Maintaining Appropriate Leverage • Net leverage targets of 1.7x – 2.7x Recent Capital Deployment Highlights $325M in share repurchases over last 6 quarters $740M in strategic acquisitions MAINTAIN INVEST RETURN ACQUIRE CAPITAL ALLOCATION FRAMEWORK Maintain Strong Balance Sheet Organic Investments Return Capital to Shareholders Disciplined M&A |
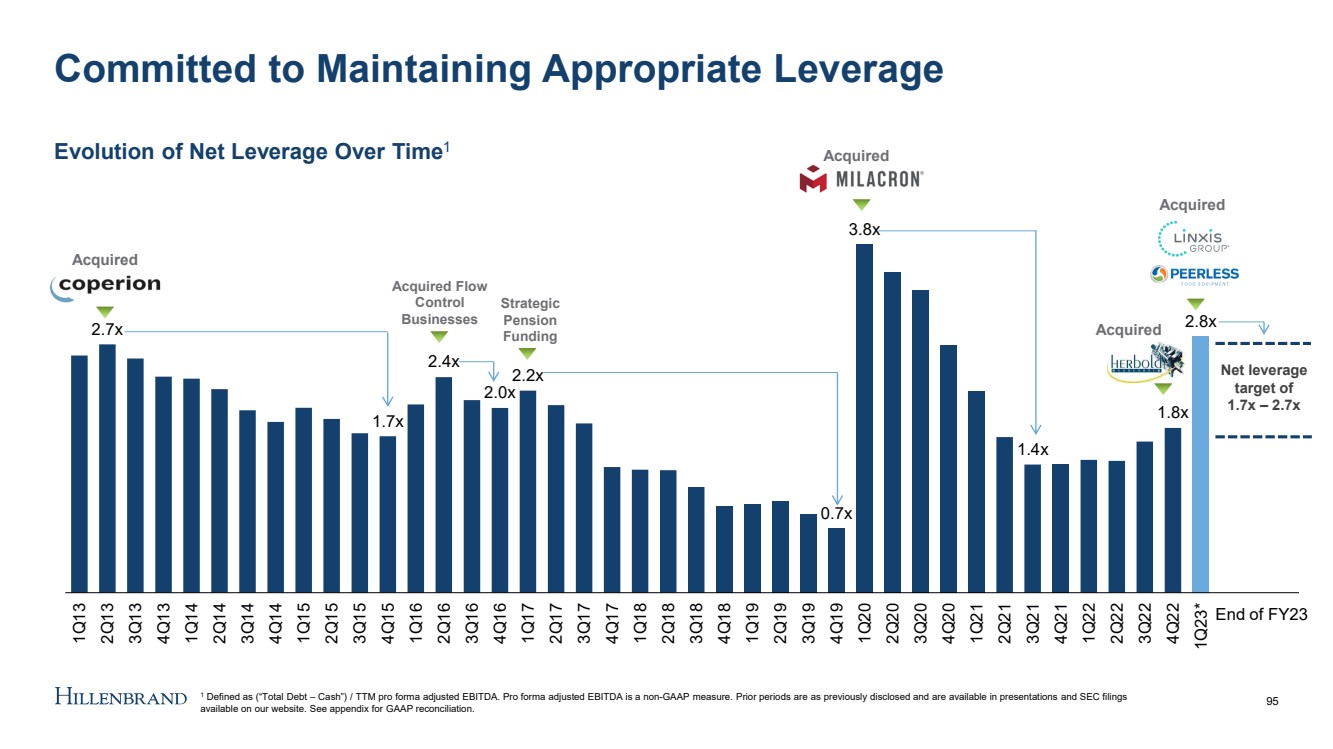
| Committed to Maintaining Appropriate Leverage 2.7x 1.7x 2.4x 2.0x 2.2x 0.7x 3.8x 1.4x 1.8x 2.8x 1Q13 2Q13 3Q13 4Q13 1Q14 2Q14 3Q14 4Q14 1Q15 2Q15 3Q15 4Q15 1Q16 2Q16 3Q16 4Q16 1Q17 2Q17 3Q17 4Q17 1Q18 2Q18 3Q18 4Q18 1Q19 2Q19 3Q19 4Q19 1Q20 2Q20 3Q20 4Q20 1Q21 2Q21 3Q21 4Q21 1Q22 2Q22 3Q22 4Q22 1Q23* Evolution of Net Leverage Over Time 1 Acquired Acquired Flow Control Businesses Strategic Pension Funding Acquired Acquired Acquired End of FY23 Net leverage target of 1.7x – 2.7x 95 1 Defined as (“Total Debt – Cash”) / TTM pro forma adjusted EBITDA. Pro forma adjusted EBITDA is a non - GAAP measure. Prior periods are as previously disclosed and are available in presentations and SEC filings available on our website. See appendix for GAAP reconciliation. |
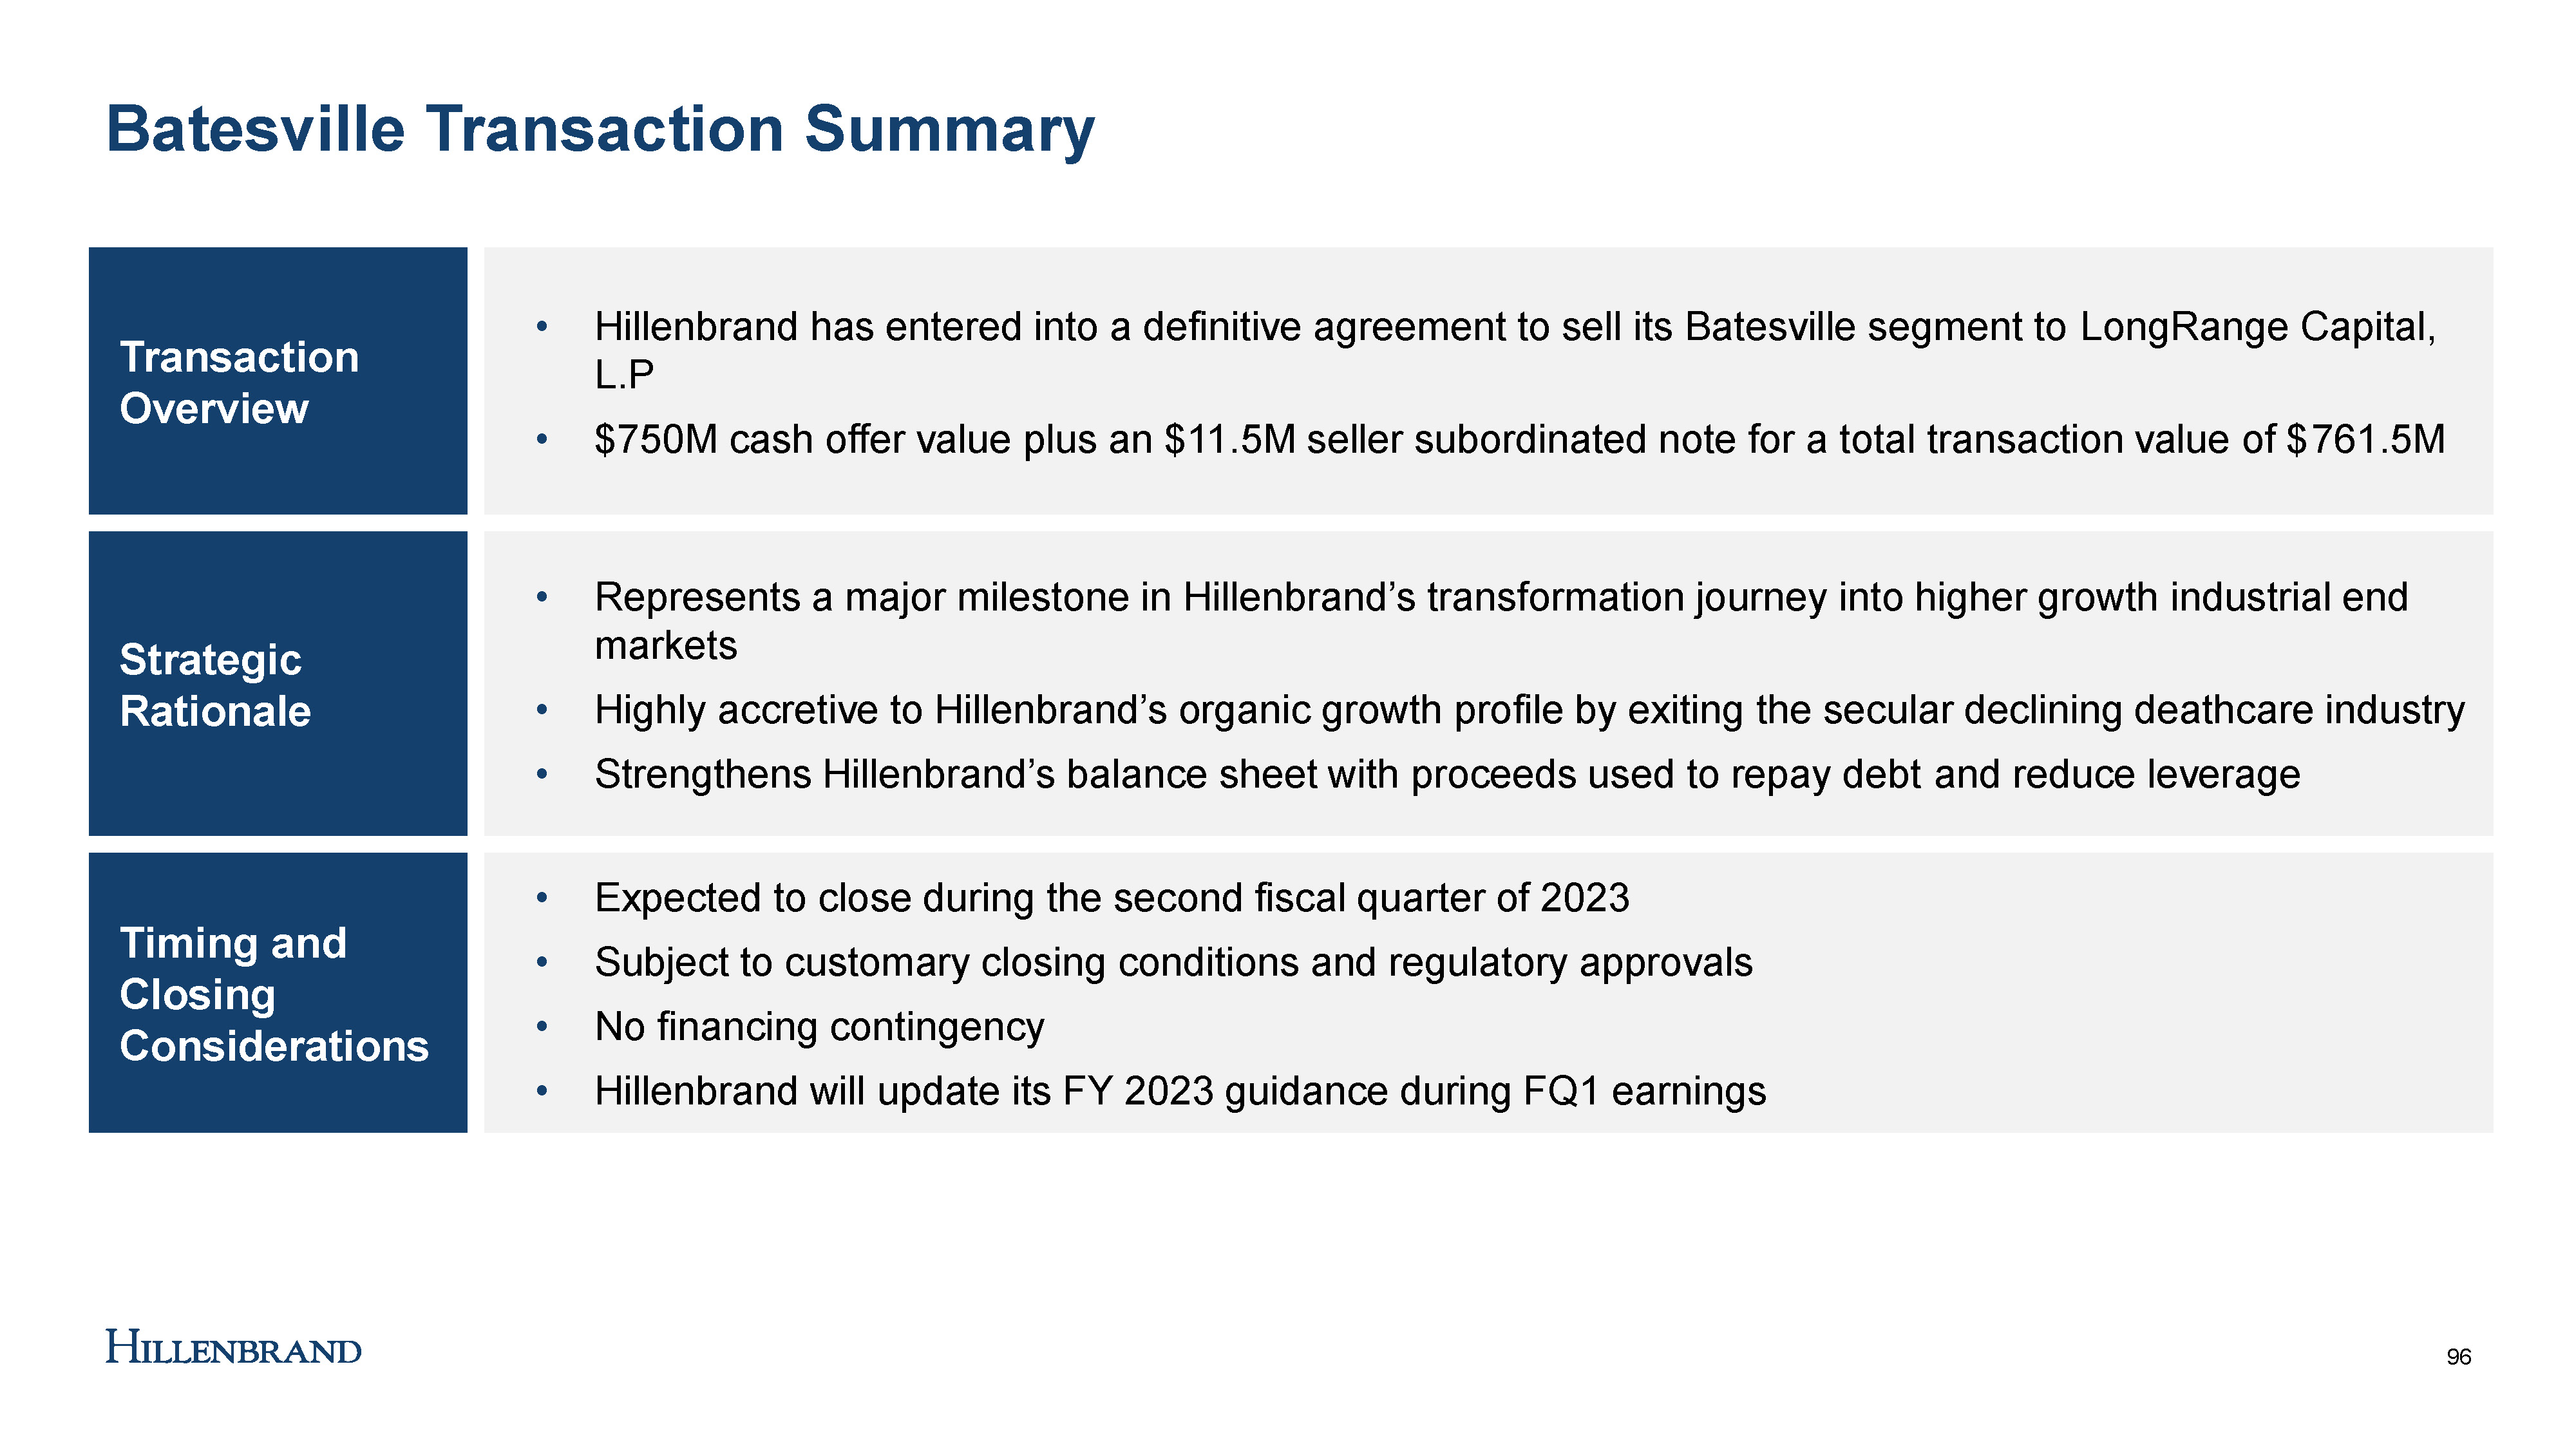
| Batesville Transaction Summary 96 1 Defined as (“Total Debt – Cash”) / TTM pro forma adjusted EBITDA. Transaction Overview • Hillenbrand has entered into a definitive agreement to sell its Batesville segment to LongRange Capital, L.P • $750M cash offer value plus an $11.5M seller subordinated note for a total transaction value of $ 761.5M Strategic Rationale • Represents a major milestone in Hillenbrand’s transformation journey into higher growth industrial end markets • Highly accretive to Hillenbrand’s organic growth profile by exiting the secular declining deathcare industry • Strengthens Hillenbrand’s balance sheet with proceeds used to repay debt and reduce leverage Timing and Closing Considerations • Expected to close during the second fiscal quarter of 2023 • Subject to customary closing conditions and regulatory approvals • No financing contingency • Hillenbrand will update its FY 2023 guidance during FQ1 earnings |
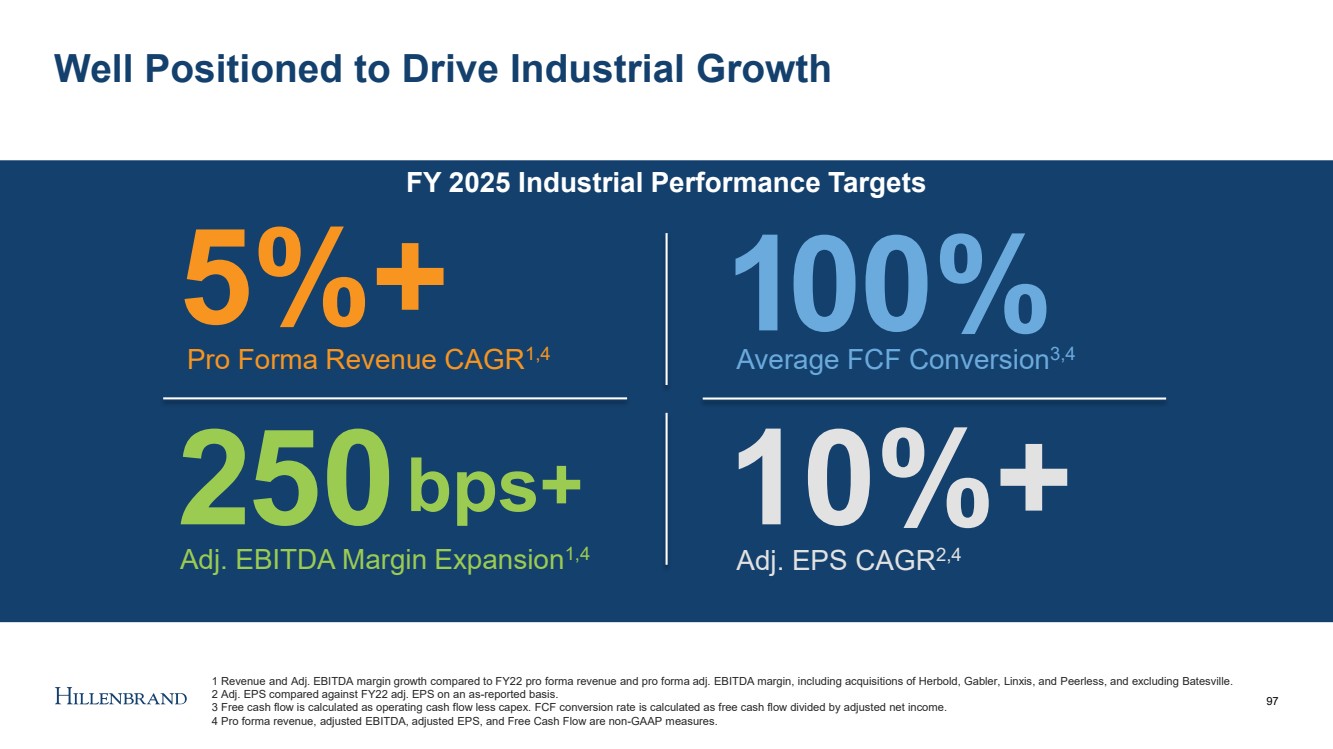
| FY 2025 Industrial Performance Targets Well Positioned to Drive Industrial Growth 97 5%+ Pro Forma Revenue CAGR 1,4 2 50 Adj. EBITDA Margin Expansion 1,4 bps+ Average FCF Conversion 3,4 1 0 0% 1 Revenue and Adj. EBITDA margin growth compared to FY22 pro forma revenue and pro forma adj. EBITDA margin, including acquisitions of Herbold, Gabler, Linxis , and Peerless, and excluding Batesville. 2 Adj. EPS compared against FY22 adj. EPS on an as - reported basis. 3 Free cash flow is calculated as operating cash flow less capex. FCF conversion rate is calculated as free cash flow divided by adjusted net income. 4 Pro forma revenue, adjusted EBITDA, adjusted EPS, and Free Cash Flow are non - GAAP measures. 10%+ Adj. EPS CAGR 2,4 |
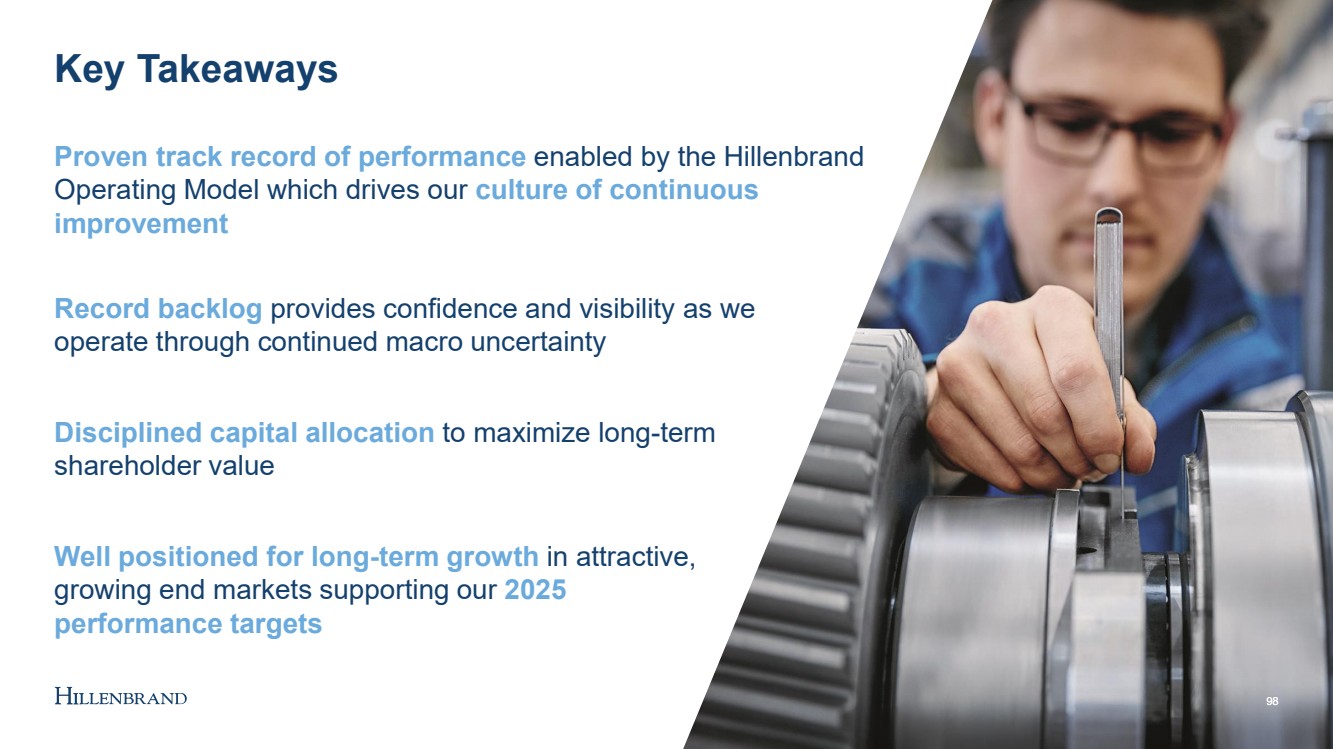
| 98 98 Proven track record of performance enabled by the Hillenbrand Operating Model which drives our culture of continuous improvement Well positioned for long - term growth in attractive, growing end markets supporting our 2025 performance targets Disciplined capital allocation to maximize long - term shareholder value Key Takeaways Record backlog provides confidence and visibility as we operate through continued macro uncertainty |
| Closing Remarks Kim Ryan – President & Chief Executive Officer 99 |

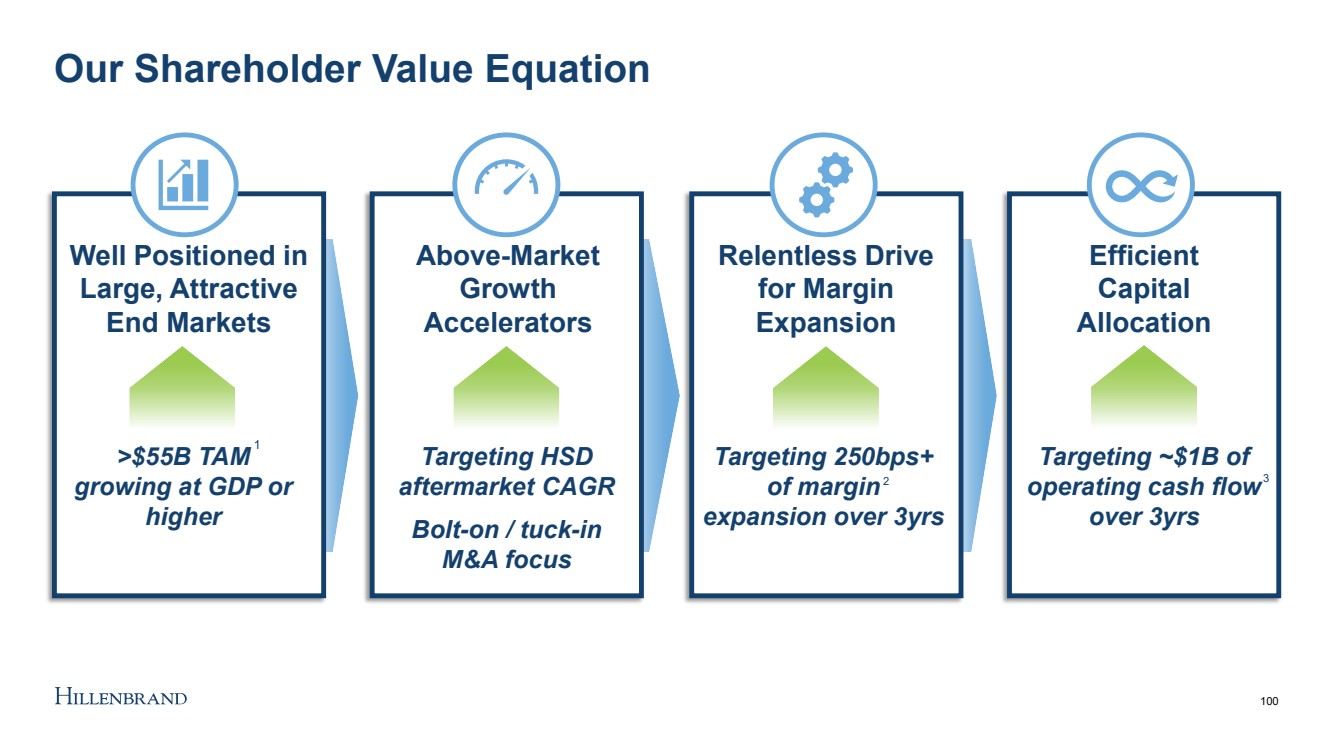
| Our Shareholder Value Equation 100 Well Positioned in Large, Attractive End Markets >$55B TAM growing at GDP or higher Above - Market Growth Accelerators Targeting HSD aftermarket CAGR Bolt - on / tuck - in M&A focus Relentless Drive for Margin Expansion Targeting 250bps+ of margin expansion over 3yrs Efficient Capital Allocation Targeting ~$1B of operating cash flow over 3yrs 1 3 2 |
| We are a pure - play global industrial leader in highly - engineered, mission - critical processing solutions We are well positioned for long - term growth aligned with secular growth trends in attractive end markets We have a proven track record of performance enabled by the Hillenbrand Operating Model which drives our culture of continuous improvement We remain focused on maximizing shareholder value through our disciplined capital allocation framework Final Takeaways 101 We are guided by our Purpose and committed to a sustainable future |
| 10 - minute break 102 |

| Q&A 103 All Presenters |

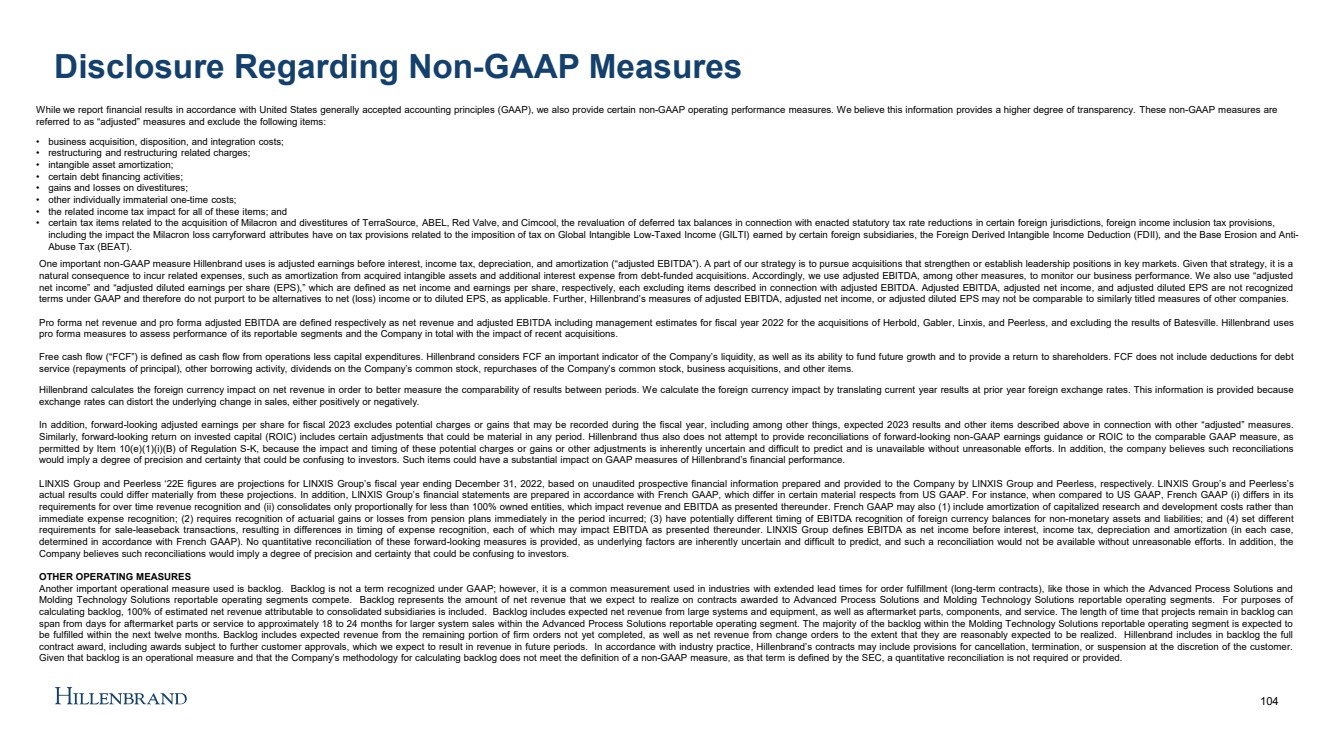
| Disclosure Regarding Non - GAAP Measures 104 While we report financial results in accordance with United States generally accepted accounting principles (GAAP), we also p rov ide certain non - GAAP operating performance measures. We believe this information provides a higher degree of transparency. These non - GAAP measures are referred to as “adjusted” measures and exclude the following items: • business acquisition, disposition, and integration costs; • restructuring and restructuring related charges; • intangible asset amortization; • certain debt financing activities; • gains and losses on divestitures; • other individually immaterial one - time costs; • the related income tax impact for all of these items; and • certain tax items related to the acquisition of Milacron and divestitures of TerraSource , ABEL, Red Valve, and Cimcool, the revaluation of deferred tax balances in connection with enacted statutory tax rate reduct ion s in certain foreign jurisdictions, foreign income inclusion tax provisions, including the impact the Milacron loss carryforward attributes have on tax provisions related to the imposition of tax on Glo bal Intangible Low - Taxed Income (GILTI) earned by certain foreign subsidiaries, the Foreign Derived Intangible Income Deduction (FD II), and the Base Erosion and Anti - Abuse Tax (BEAT). One important non - GAAP measure Hillenbrand uses is adjusted earnings before interest, income tax, depreciation, and amortization (“adjusted EBITDA”) .. A part of our strategy is to pursue acquisitions that strengthen or establish leadership positions in key markets .. Given that strategy, it is a natural consequence to incur related expenses, such as amortization from acquired intangible assets and additional interest expense from debt - funded acquisitions .. Accordingly, we use adjusted EBITDA, among other measures, to monitor our business performance .. We also use “adjusted net income” and “adjusted diluted earnings per share (EPS),” which are defined as net income and earnings per share, respectively, each excluding items described in connection with adjusted EBITDA .. Adjusted EBITDA, adjusted net income, and adjusted diluted EPS are not recognized terms under GAAP and therefore do not purport to be alternatives to net (loss) income or to diluted EPS, as applicable .. Further, Hillenbrand’s measures of adjusted EBITDA, adjusted net income, or adjusted diluted EPS may not be comparable to similarly titled measures of other companies .. Pro forma net revenue and pro forma adjusted EBITDA are defined respectively as net revenue and adjusted EBITDA including management estimates for fiscal year 2022 for the acquisitions of Herbold, Gabler, Linxis , and Peerless, and excluding the results of Batesville .. Hillenbrand uses pro forma measures to assess performance of its reportable segments and the Company in total with the impact of recent acquisitions .. Free cash flow (“FCF”) is defined as cash flow from operations less capital expenditures .. Hillenbrand considers FCF an important indicator of the Company’s liquidity, as well as its ability to fund future growth and to provide a return to shareholders .. FCF does not include deductions for debt service (repayments of principal), other borrowing activity, dividends on the Company’s common stock, repurchases of the Company’s common stock, business acquisitions, and other items .. Hillenbrand calculates the foreign currency impact on net revenue in order to better measure the comparability of results between periods .. We calculate the foreign currency impact by translating current year results at prior year foreign exchange rates .. This information is provided because exchange rates can distort the underlying change in sales, either positively or negatively .. In addition, forward - looking adjusted earnings per share for fiscal 2023 excludes potential charges or gains that may be recorded during the fiscal year, including among other things, expected 2023 results and other items described above in connection with other “adjusted” measures .. Similarly, forward - looking return on invested capital (ROIC) includes certain adjustments that could be material in any period .. Hillenbrand thus also does not attempt to provide reconciliations of forward - looking non - GAAP earnings guidance or ROIC to the comparable GAAP measure, as permitted by Item 10 (e)( 1 )(i)(B) of Regulation S - K, because the impact and timing of these potential charges or gains or other adjustments is inherently uncertain and difficult to predict and is unavailable without unreasonable efforts .. In addition, the company believes such reconciliations would imply a degree of precision and certainty that could be confusing to investors .. Such items could have a substantial impact on GAAP measures of Hillenbrand’s financial performance .. LINXIS Group and Peerless ‘ 22 E figures are projections for LINXIS Group’s fiscal year ending December 31 , 2022 , based on unaudited prospective financial information prepared and provided to the Company by LINXIS Group and Peerless, respectively .. LINXIS Group’s and Peerless’s actual results could differ materially from these projections .. In addition, LINXIS Group’s financial statements are prepared in accordance with French GAAP, which differ in certain material respects from US GAAP .. For instance, when compared to US GAAP, French GAAP (i) differs in its requirements for over time revenue recognition and (ii) consolidates only proportionally for less than 100 % owned entities, which impact revenue and EBITDA as presented thereunder .. French GAAP may also ( 1 ) include amortization of capitalized research and development costs rather than immediate expense recognition ; ( 2 ) requires recognition of actuarial gains or losses from pension plans immediately in the period incurred ; ( 3 ) have potentially different timing of EBITDA recognition of foreign currency balances for non - monetary assets and liabilities ; and ( 4 ) set different requirements for sale - leaseback transactions, resulting in differences in timing of expense recognition, each of which may impact EBITDA as presented thereunder .. LINXIS Group defines EBITDA as net income before interest, income tax, depreciation and amortization (in each case, determined in accordance with French GAAP) .. No quantitative reconciliation of these forward - looking measures is provided, as underlying factors are inherently uncertain and difficult to predict, and such a reconciliation would not be available without unreasonable efforts .. In addition, the Company believes such reconciliations would imply a degree of precision and certainty that could be confusing to investors .. OTHER OPERATING MEASURES Another important operational measure used is backlog .. Backlog is not a term recognized under GAAP ; however, it is a common measurement used in industries with extended lead times for order fulfillment (long - term contracts), like those in which the Advanced Process Solutions and Molding Technology Solutions reportable operating segments compete .. Backlog represents the amount of net revenue that we expect to realize on contracts awarded to Advanced Process Solutions and Molding Technology Solutions reportable operating segments .. For purposes of calculating backlog, 100 % of estimated net revenue attributable to consolidated subsidiaries is included .. Backlog includes expected net revenue from large systems and equipment, as well as aftermarket parts, components, and service .. The length of time that projects remain in backlog can span from days for aftermarket parts or service to approximately 18 to 24 months for larger system sales within the Advanced Process Solutions reportable operating segment .. The majority of the backlog within the Molding Technology Solutions reportable operating segment is expected to be fulfilled within the next twelve months .. Backlog includes expected revenue from the remaining portion of firm orders not yet completed, as well as net revenue from change orders to the extent that they are reasonably expected to be realized .. Hillenbrand includes in backlog the full contract award, including awards subject to further customer approvals, which we expect to result in revenue in future periods .. In accordance with industry practice, Hillenbrand’s contracts may include provisions for cancellation, termination, or suspension at the discretion of the customer .. Given that backlog is an operational measure and that the Company’s methodology for calculating backlog does not meet the definition of a non - GAAP measure, as that term is defined by the SEC, a quantitative reconciliation is not required or provided .. |
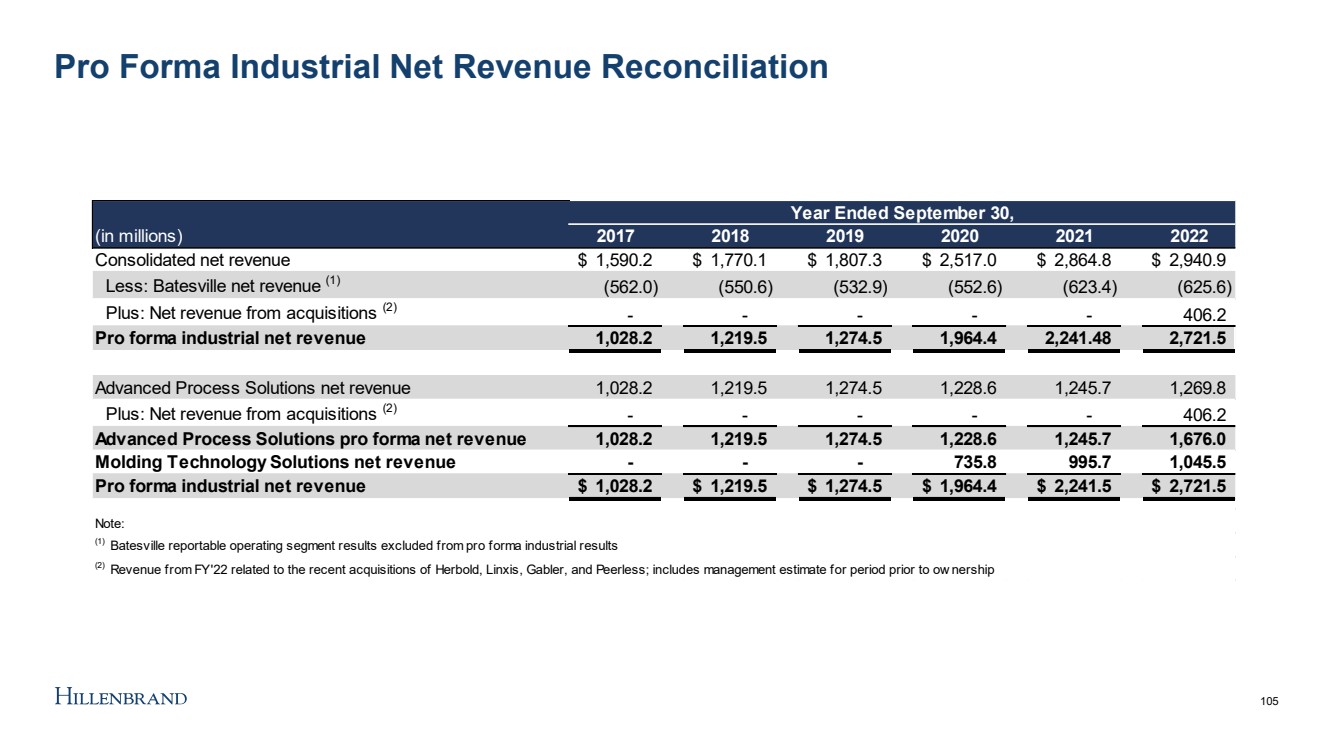
| Pro Forma Industrial Net Revenue Reconciliation (in millions) 2017 2018 2019 2020 2021 2022 Consolidated net revenue 1,590.2 $ 1,770.1 $ 1,807.3 $ 2,517.0 $ 2,864.8 $ 2,940.9 $ Less: Batesville net revenue (1) (562.0) (550.6) (532.9) (552.6) (623.4) (625.6) Plus: Net revenue from acquisitions (2) - - - - - 406.2 Pro forma industrial net revenue 1,028.2 1,219.5 1,274.5 1,964.4 2,241.48 2,721.5 Advanced Process Solutions net revenue 1,028.2 1,219.5 1,274.5 1,228.6 1,245.7 1,269.8 Plus: Net revenue from acquisitions (2) - - - - - 406.2 Advanced Process Solutions pro forma net revenue 1,028.2 1,219.5 1,274.5 1,228.6 1,245.7 1,676.0 Molding Technology Solutions net revenue - - - 735.8 995.7 1,045.5 Pro forma industrial net revenue 1,028.2 $ 1,219.5 $ 1,274.5 $ 1,964.4 $ 2,241.5 $ 2,721.5 $ Note: (1) Batesville reportable operating segment results excluded from pro forma industrial results (2) Revenue from FY'22 related to the recent acquisitions of Herbold, Linxis, Gabler, and Peerless; includes management estimate for period prior to ownership Year Ended September 30, 105 |
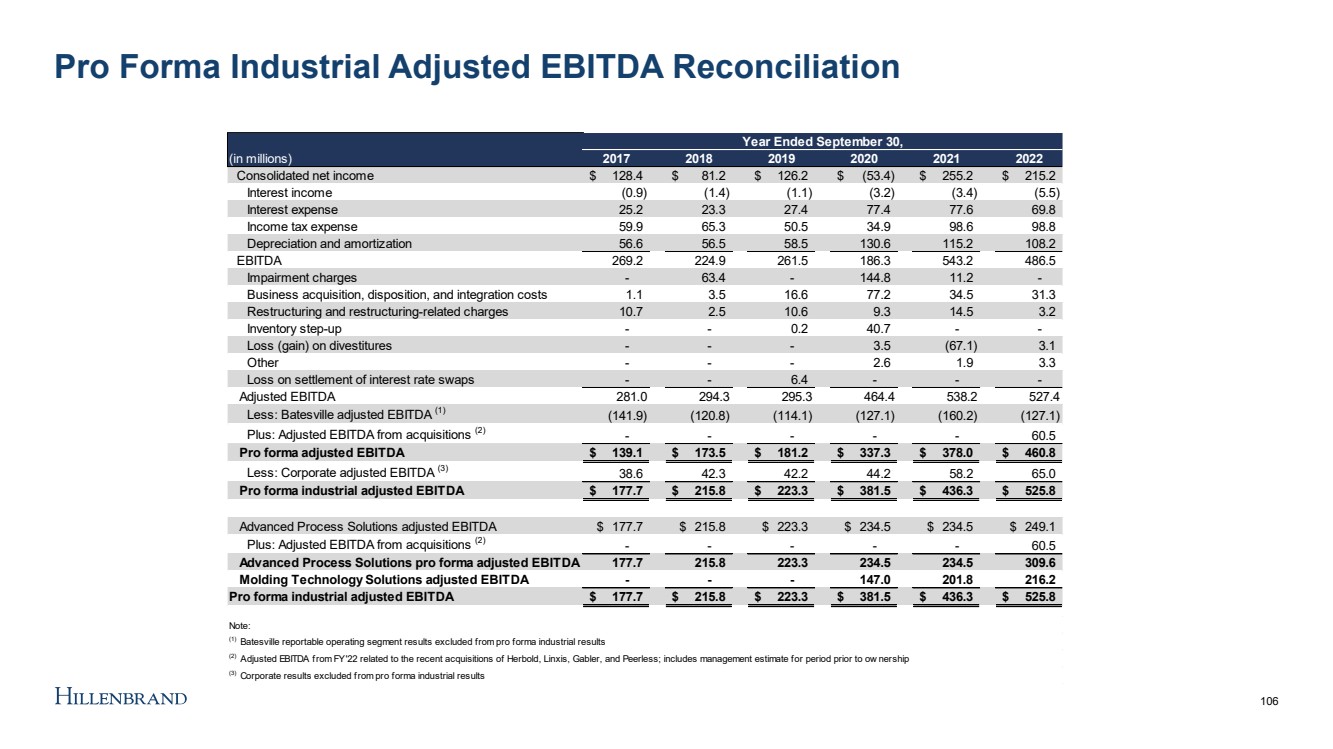
| Pro Forma Industrial Adjusted EBITDA Reconciliation (in millions) 2017 2018 2019 2020 2021 2022 Consolidated net income 128.4 $ 81.2 $ 126.2 $ (53.4) $ 255.2 $ 215.2 $ Interest income (0.9) (1.4) (1.1) (3.2) (3.4) (5.5) Interest expense 25.2 23.3 27.4 77.4 77.6 69.8 Income tax expense 59.9 65.3 50.5 34.9 98.6 98.8 Depreciation and amortization 56.6 56.5 58.5 130.6 115.2 108.2 EBITDA 269.2 224.9 261.5 186.3 543.2 486.5 Impairment charges - 63.4 - 144.8 11.2 - Business acquisition, disposition, and integration costs 1.1 3.5 16.6 77.2 34.5 31.3 Restructuring and restructuring-related charges 10.7 2.5 10.6 9.3 14.5 3.2 Inventory step-up - - 0.2 40.7 - - Loss (gain) on divestitures - - - 3.5 (67.1) 3.1 Other - - - 2.6 1.9 3.3 Loss on settlement of interest rate swaps - - 6.4 - - - Adjusted EBITDA 281.0 294.3 295.3 464.4 538.2 527.4 Less: Batesville adjusted EBITDA (1) (141.9) (120.8) (114.1) (127.1) (160.2) (127.1) Plus: Adjusted EBITDA from acquisitions (2) - - - - - 60.5 Pro forma adjusted EBITDA 139.1 $ 173.5 $ 181.2 $ 337.3 $ 378.0 $ 460.8 $ Less: Corporate adjusted EBITDA (3) 38.6 42.3 42.2 44.2 58.2 65.0 Pro forma industrial adjusted EBITDA 177.7 $ 215.8 $ 223.3 $ 381.5 $ 436.3 $ 525.8 $ Advanced Process Solutions adjusted EBITDA 177.7 $ 215.8 $ 223.3 $ 234.5 $ 234.5 $ 249.1 $ Plus: Adjusted EBITDA from acquisitions (2) - - - - - 60.5 Advanced Process Solutions pro forma adjusted EBITDA 177.7 215.8 223.3 234.5 234.5 309.6 Molding Technology Solutions adjusted EBITDA - - - 147.0 201.8 216.2 Pro forma industrial adjusted EBITDA 177.7 $ 215.8 $ 223.3 $ 381.5 $ 436.3 $ 525.8 $ Note: (1) Batesville reportable operating segment results excluded from pro forma industrial results (2) Adjusted EBITDA from FY'22 related to the recent acquisitions of Herbold, Linxis, Gabler, and Peerless; includes management estimate for period prior to ownership (3) Corporate results excluded from pro forma industrial results Year Ended September 30, 106 |
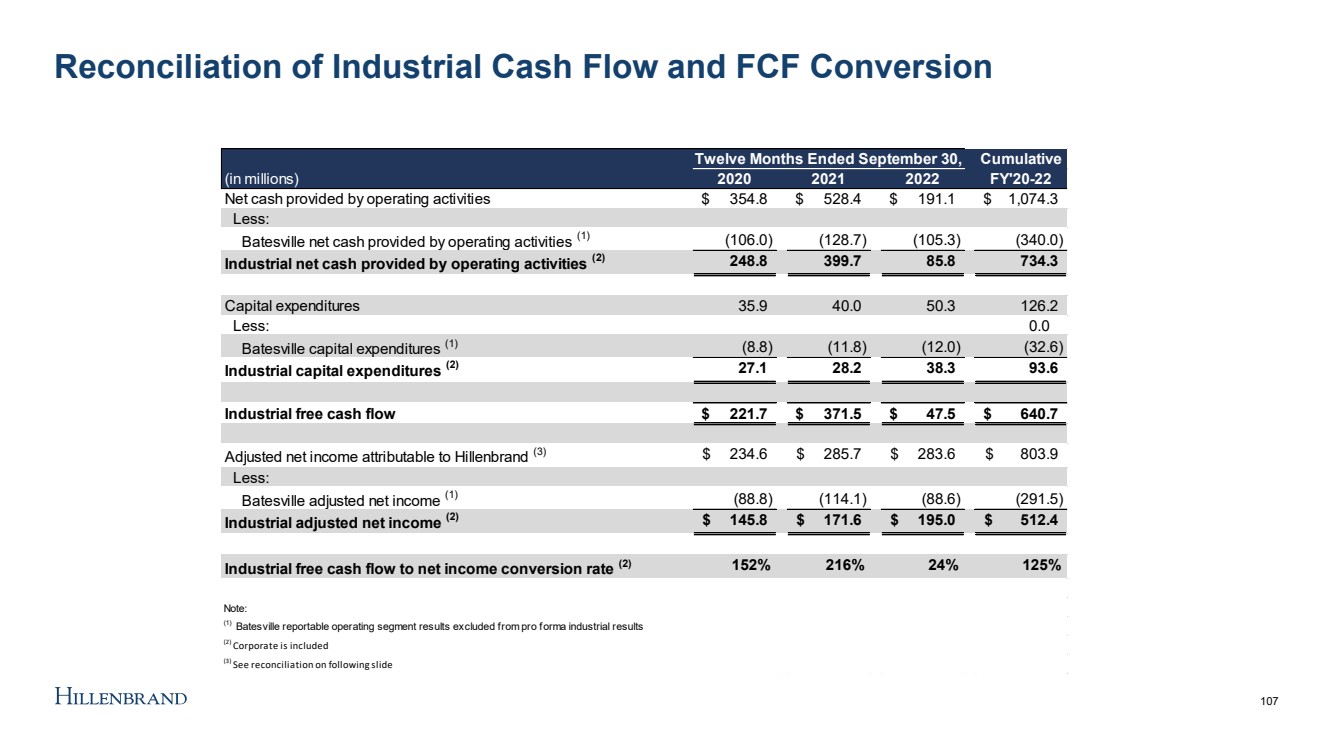
| Reconciliation of Industrial Cash Flow and FCF Conversion Cumulative (in millions) 2020 2021 2022 FY'20-22 Net cash provided by operating activities 354.8 $ 528.4 $ 191.1 $ 1,074.3 $ Less: Batesville net cash provided by operating activities (1) (106.0) (128.7) (105.3) (340.0) Industrial net cash provided by operating activities (2) 248.8 399.7 85.8 734.3 Capital expenditures 35.9 40.0 50.3 126.2 Less: 0.0 Batesville capital expenditures (1) (8.8) (11.8) (12.0) (32.6) Industrial capital expenditures (2) 27.1 28.2 38.3 93.6 Industrial free cash flow 221.7 $ 371.5 $ 47.5 $ 640.7 $ Adjusted net income attributable to Hillenbrand (3) 234.6 $ 285.7 $ 283.6 $ 803.9 $ Less: Batesville adjusted net income (1) (88.8) (114.1) (88.6) (291.5) Industrial adjusted net income (2) 145.8 $ 171.6 $ 195.0 $ 512.4 $ Industrial free cash flow to net income conversion rate (2) 152% 216% 24% 125% Note: (1) Batesville reportable operating segment results excluded from pro forma industrial results (2) Corporate is included (3) See reconciliation on following slide Twelve Months Ended September 30, 107 |
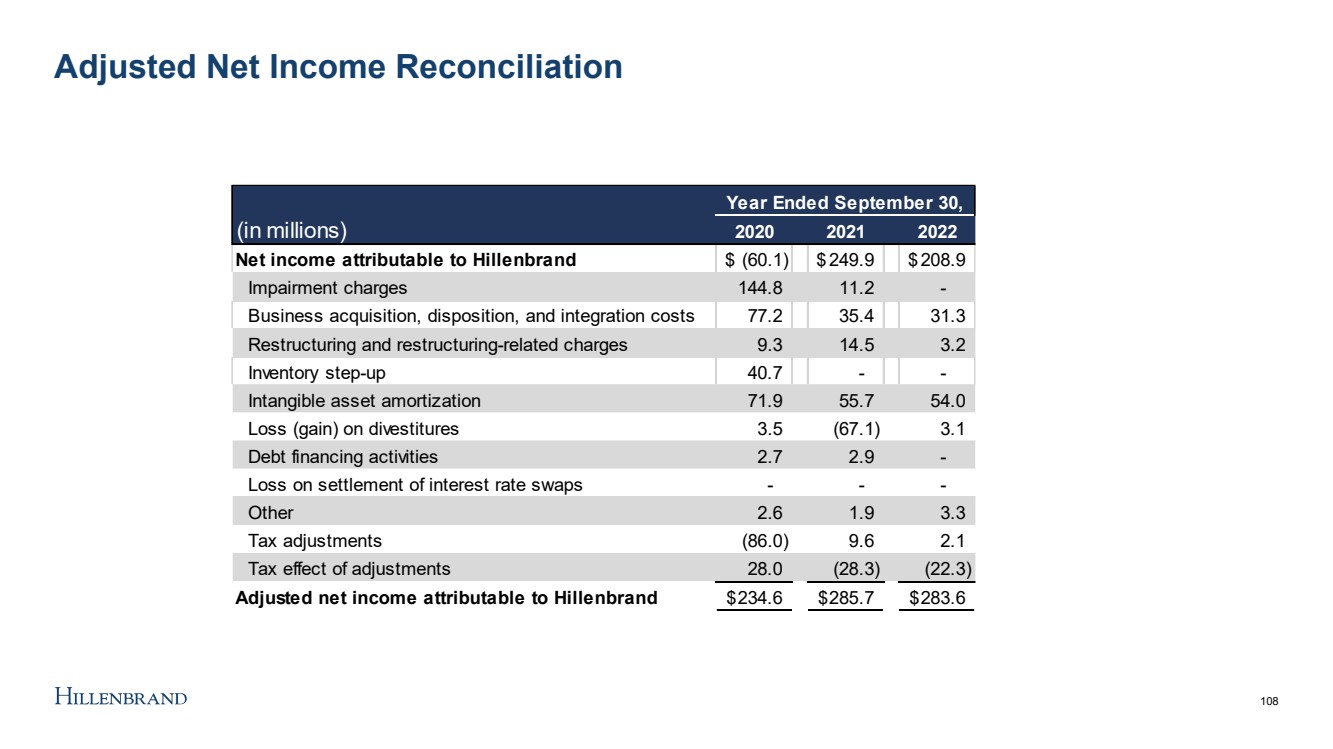
| Adjusted Net Income Reconciliation (in millions) 2020 2021 2022 Net income attributable to Hillenbrand (60.1) $ 249.9 $ 208.9 $ Impairment charges 144.8 11.2 - Business acquisition, disposition, and integration costs 77.2 35.4 31.3 Restructuring and restructuring-related charges 9.3 14.5 3.2 Inventory step-up 40.7 - - Intangible asset amortization 71.9 55.7 54.0 Loss (gain) on divestitures 3.5 (67.1) 3.1 Debt financing activities 2.7 2.9 - Loss on settlement of interest rate swaps - - - Other 2.6 1.9 3.3 Tax adjustments (86.0) 9.6 2.1 Tax effect of adjustments 28.0 (28.3) (22.3) Adjusted net income attributable to Hillenbrand 234.6 $ 285.7 $ 283.6 $ Year Ended September 30, 108 |
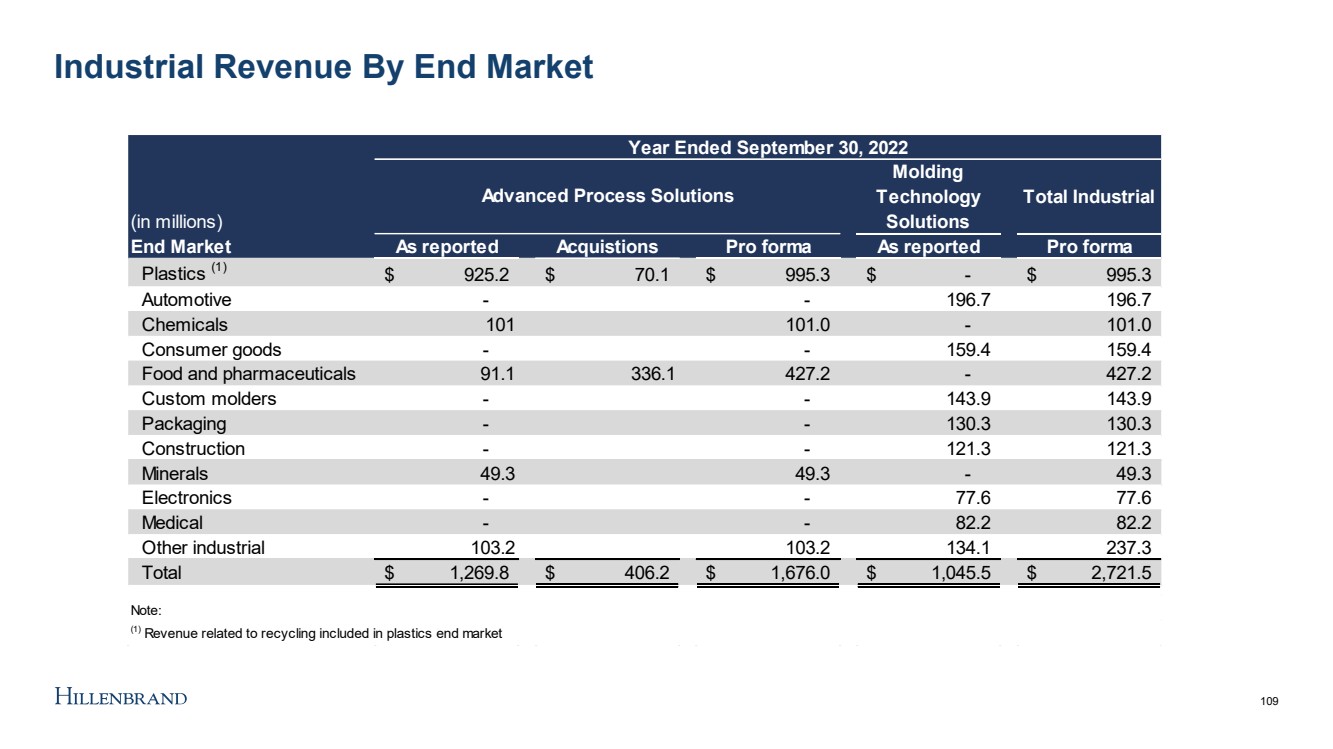
| Industrial Revenue By End Market (in millions) Molding Technology Solutions Total Industrial End Market As reported Acquistions Pro forma As reported Pro forma Plastics (1) 925.2 $ 70.1 $ 995.3 $ - $ 995.3 $ Automotive - - 196.7 196.7 Chemicals 101 101.0 - 101.0 Consumer goods - - 159.4 159.4 Food and pharmaceuticals 91.1 336.1 427.2 - 427.2 Custom molders - - 143.9 143.9 Packaging - - 130.3 130.3 Construction - - 121.3 121.3 Minerals 49.3 49.3 - 49.3 Electronics - - 77.6 77.6 Medical - - 82.2 82.2 Other industrial 103.2 103.2 134.1 237.3 Total 1,269.8 $ 406.2 $ 1,676.0 $ 1,045.5 $ 2,721.5 $ Note: (1) Revenue related to recycling included in plastics end market Advanced Process Solutions Year Ended September 30, 2022 109 |
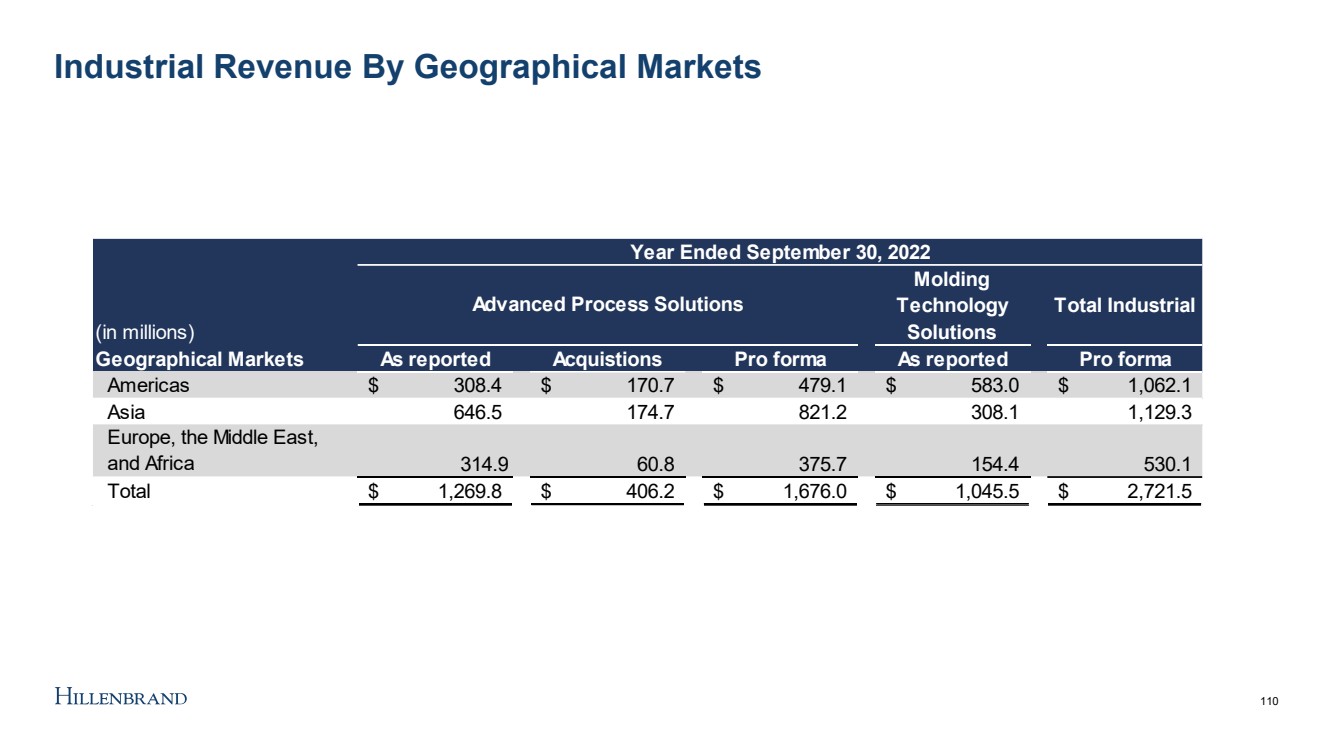
| Industrial Revenue By Geographical Markets (in millions) Molding Technology Solutions Total Industrial Geographical Markets As reported Acquistions Pro forma As reported Pro forma Americas 308.4 $ 170.7 $ 479.1 $ 583.0 $ 1,062.1 $ Asia 646.5 174.7 821.2 308.1 1,129.3 Europe, the Middle East, and Africa 314.9 60.8 375.7 154.4 530.1 Total 1,269.8 $ 406.2 $ 1,676.0 $ 1,045.5 $ 2,721.5 $ Year Ended September 30, 2022 Advanced Process Solutions 110 |
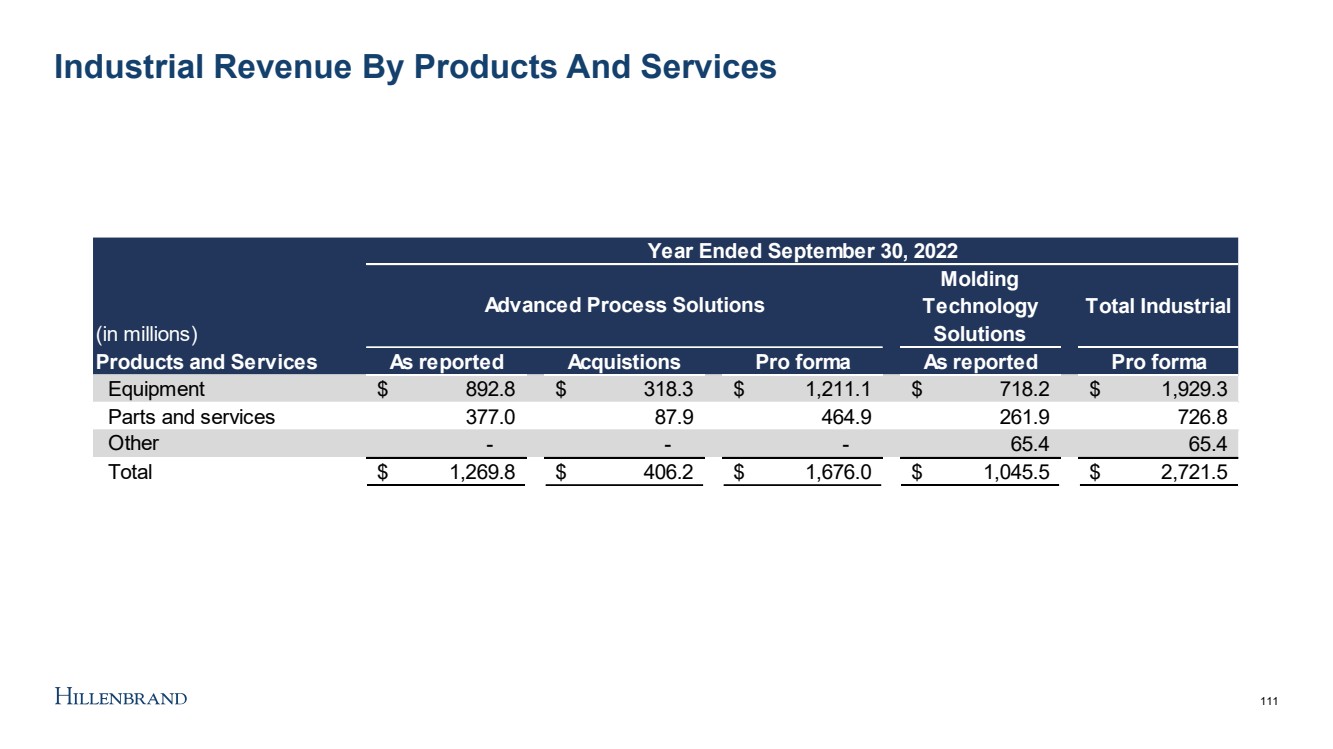
| Industrial Revenue By Products And Services (in millions) Molding Technology Solutions Total Industrial Products and Services As reported Acquistions Pro forma As reported Pro forma Equipment 892.8 $ 318.3 $ 1,211.1 $ 718.2 $ 1,929.3 $ Parts and services 377.0 87.9 464.9 261.9 726.8 Other - - - 65.4 65.4 Total 1,269.8 $ 406.2 $ 1,676.0 $ 1,045.5 $ 2,721.5 $ Year Ended September 30, 2022 Advanced Process Solutions 111 |