Exhibit 99.1
|
|
Jefferies Industrial Conference August 14, 2013 Pursuing Growth • Building Value a global diversified industrial company |

Exhibit 99.1
|
|
Jefferies Industrial Conference August 14, 2013 Pursuing Growth • Building Value a global diversified industrial company |
|
|
Forward-Looking Statements and Factors That May Affect Future Results Throughout this presentation, we make a number of “forward-looking statements” within the meaning of the Private Securities Litigation Reform Act of 1995. As the words imply, these are statements about future plans, objectives, beliefs, and expectations that might or might not happen in the future, as contrasted with historical information. Forward-looking statements are based on assumptions that we believe are reasonable, but by their very nature are subject to a wide range of risks. Accordingly, in this presentation, we may say something like, “We expect that future revenue associated with the Process Equipment Group will be influenced by order backlog.” That is a forward-looking statement, as indicated by the word “expect” and by the clear meaning of the sentence. Other words that could indicate we are making forward-looking statements include: This is not an exhaustive list, but is intended to give you an idea of how we try to identify forward-looking statements. The absence of any of these words, however, does not mean that the statement is not forward-looking. Here is the key point: Forward-looking statements are not guarantees of future performance, and our actual results could differ materially from those set forth in any forward-looking statements. Any number of factors, many of which are beyond our control, could cause our performance to differ significantly from what is described in the forward-looking statements. For a discussion of factors that could cause actual results to differ from those contained in forward-looking statements, see the discussions under the heading “Risk Factors” in Item 1A of our Form 10-Q for the period ended June 30, 2013, located on our website and filed with the SEC. We assume no obligation to update or revise any forward-looking statements. Disclosure regarding forward-looking statements 2 |
|
|
Agenda Hillenbrand a global diversified industrial company Process Equipment Group (PEG) our high-growth business platform Batesville our time-tested and highly profitable market leader Select Financial Results 3 |
|
|
Hillenbrand is an attractive investment opportunity Market leading platforms with robust cash generation Strong balance sheet and cash flow Process Equipment Group represents ~2/3 of Hillenbrand revenue with attractive organic mid to high single-digit growth expected Bottom-line growth enhanced by leveraging core competencies Meaningful return of cash to shareholders, including an attractive dividend yield Annual dividend increases since HI inception (2008) Strong Financial Profile Growth Opportunity Compelling Dividend Proven Track Record Demonstrated acquisition success Proven, results-oriented management teams Strong core competencies in lean business, strategy management and talent development 4 |
|
|
Hillenbrand Profile 5 |
|
|
Hillenbrand began as a funeral products company and has diversified through acquisitions Leading global providers of compounding and extrusion equipment, bulk solids material handling equipment and systems for a wide variety of manufacturing and other industrial processes Serves customers through its operating companies: Coperion - Compounding & extrusion equipment, materials handling equipment, system solutions, parts and services K-Tron – Feeding and pneumatic conveying equipment, parts and services TerraSource Global– Size reduction equipment, conveying systems and screening equipment, parts and services ROTEX – Dry material separation machines and replacement parts and accessories Founded in 1906 and dedicated for more than 100 years to helping families honor the lives of those they love® North American leader in funeral products with a history of manufacturing excellence, product innovation, superior customer service, and reliable delivery 2007 2008 2009 2010 Hillenbrand Industries approves the separation of Hill-Rom and Batesville Casket into two independent publicly traded companies Hillenbrand, Inc. (parent of Batesville Casket Company) begins operation April 1, 2008 K-Tron Acquisition (includes TerraSource) April 1, 2010 Batesville Process Equipment Group 2011 Rotex acquisition September 1, 2011 2012 Coperion acquisition December 1, 2012 6 |
|
|
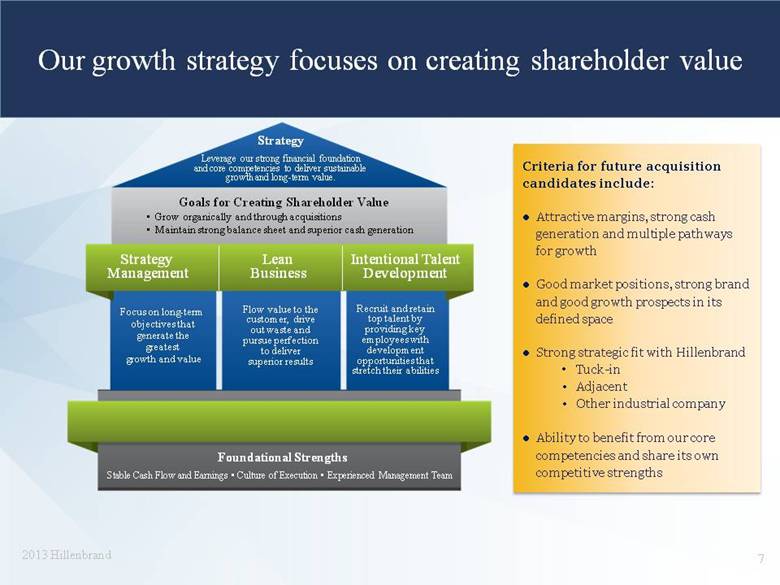
Leverage our strong financial foundation and core competencies to deliver sustainable growth and long-term value. Goals for Creating Shareholder Value • Grow organically and through acquisitions • Maintain strong balance sheet and superior cash generation Strategy Management Lean Business Intentional Talent Development Focus on long-term objectives that generate the greatest growth and value Flow value to the customer, drive out waste and pursue perfection to deliver superior results Recruit and retain top talent by providing key employees with development opportunities that stretch their abilities Stable Cash Flow and Earnings • Culture of Execution • Experienced Management Team Criteria for future acquisition candidates include: Attractive margins, strong cash generation and multiple pathways for growth Good market positions, strong brand and good growth prospects in its defined space Strong strategic fit with Hillenbrand Tuck-in Adjacent Other industrial company Ability to benefit from our core competencies and share its own competitive strengths Our growth strategy focuses on creating shareholder value 7 Foundation Strengths strategy |
|
|
Two attractive platforms provide robust revenue growth Multiple pathways/end markets for growth Diversified revenue sources Parts and service revenue ~ 1/3 of total Adj EBITDA* margin > 25% Strong, predictable cash flow Batesville 25% CAGR *See Appendix for reconciliation 15% CAGR TerraSource Process Equipment Group 8 |
|
|
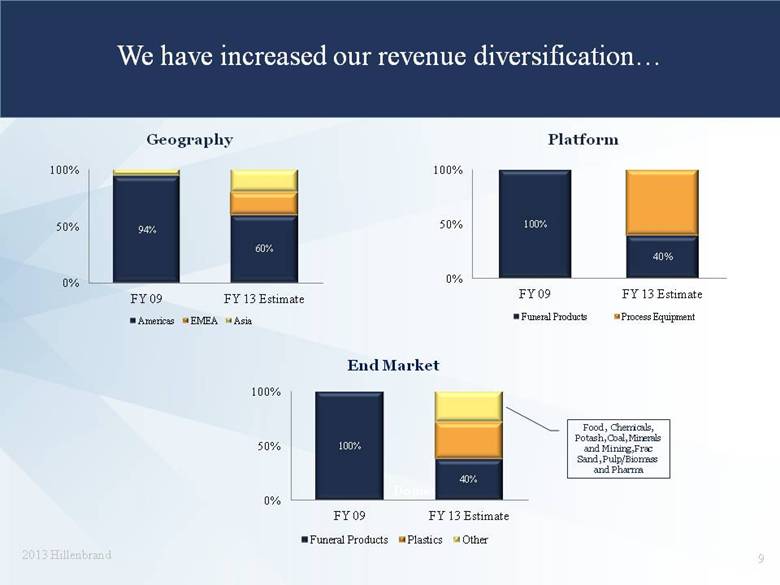
We have increased our revenue diversification... Geography Platform Domestic End Market Food, Chemicals, Potash, Coal, Minerals and Mining, Frac Sand, Pulp/Biomass and Pharma 9 |
|
|
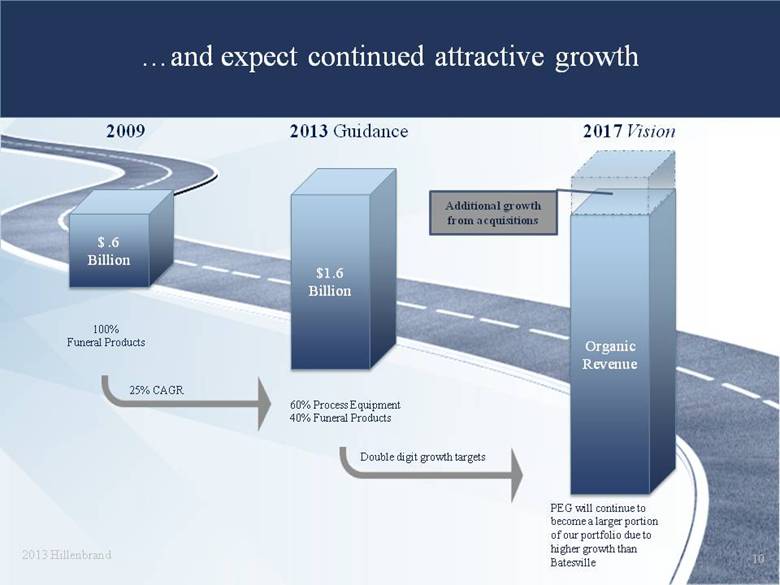
...and expect continued attractive growth $ .6 Billion 2013 Guidance 2017 Vision 2009 $1.6 Billion Organic Revenue 25% CAGR 60% Process Equipment 40% Funeral Products Double digit growth targets 100% Funeral Products PEG will continue to become a larger portion of our portfolio due to higher growth than Batesville Additional growth from acquisitions 10 |
|
|
Process Equipment Group Overview 11 |
|
|
Our Process Equipment Group companies manufacture mission critical world-class industrial equipment 2010 2011 2012 Rotex Screening equipment Separating equipment Crushers Biomass handling equipment Feeders Pneumatic conveying equipment System solutions TerraSource Global K-Tron Compounding & extrusion equipment Materials handling equipment System solutions Coperion Year acquired 12 |
|
|
Sampling of Blue Chip Customer Mix Process Equipment Group has attractive fundamentals Revenue Mix by Geography* Revenue Mix by Type* Parts & Service Machines Balanced geographic diversification Stable revenue and attractive margins from parts and service business Highly diversified customer base with a strong history of long-term relationships with blue-chip customers Proven products with substantial brand value and recognition, combined with industry-leading applications and engineering expertise PEG Brands * FY 2013 ESTIMATE 13 |
|
|
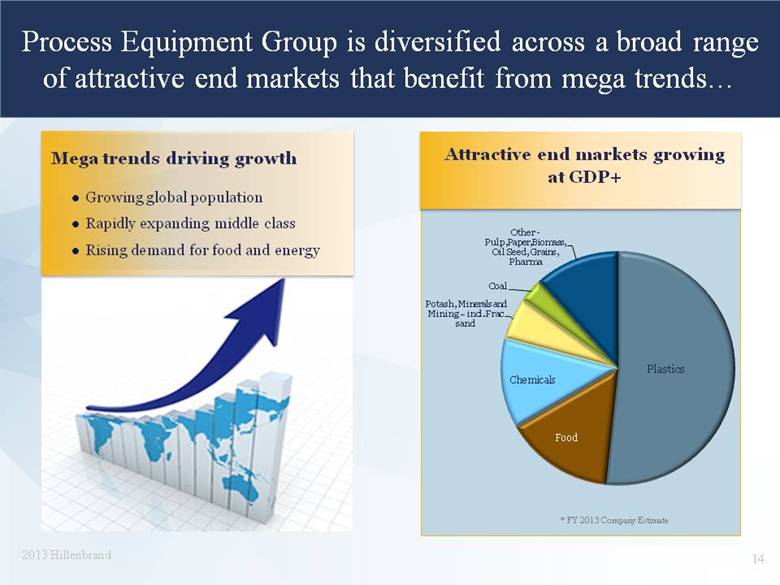
Process Equipment Group is diversified across a broad range of attractive end markets that benefit from mega trends... Mega trends driving growth Growing global population Rapidly expanding middle class Rising demand for food and energy Attractive end markets growing at GDP+ * FY 2013 Company Estimate 14 |
|
|
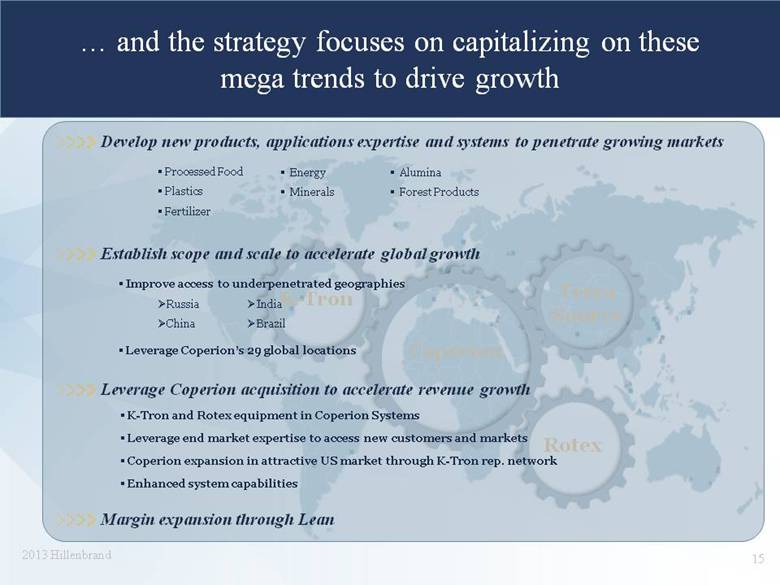
...and the strategy focuses on capitalizing on these mega trends to drive growth K-Tron Rotex Terra Source Coperion Develop new products, applications expertise and systems to penetrate growing markets Processed Food Plastics Fertilizer Establish scope and scale to accelerate global growth Improve access to underpenetrated geographies Russia China Leverage Coperion’s 29 global locations Leverage Coperion acquisition to accelerate revenue growth K-Tron and Rotex equipment in Coperion Systems Leverage end market expertise to access new customers and markets Coperion expansion in attractive US market through K-Tron rep. network Enhanced system capabilities Margin expansion through Lean India Brazil Energy Minerals 15 Alumina Forest Products |
|
|
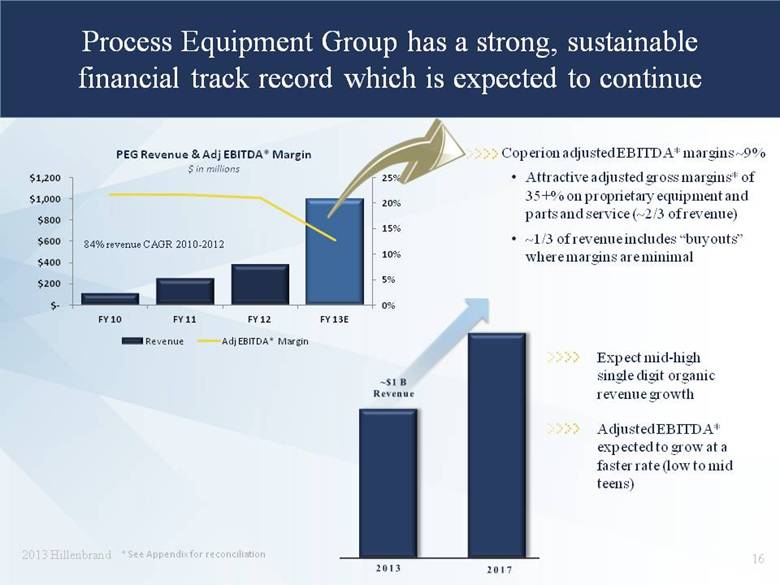
Process Equipment Group has a strong, sustainable financial track record which is expected to continue Expect mid-high single digit organic revenue growth Adjusted EBITDA* expected to grow at a faster rate (low to mid teens) * See Appendix for reconciliation Coperion adjusted EBITDA* margins ~9% Attractive adjusted gross margins* of 35+% on proprietary equipment and parts and service (~2/3 of revenue) ~1/3 of revenue includes “buyouts” where margins are minimal 84% revenue CAGR 2010-2012 16 |
|
|
Batesville Overview 17 |
|
|
Other (100+) Batesville Importers Aurora Matthews Caskets Market Leader Grave Markers Cremation Market Leader Vaults Batesville is the industry leader in the largest and most profitable segment of the North American funeral products industry Batesville Caskets North American Funeral Products ($2.6 Billion Industry) North American Caskets (Total Revenue $1.3 Billion) Batesville (Total 2012 Revenue: $607 Million) Other, including Options, Batesville Interactive and Northstar Source: Company estimates, industry reports and public filings for FY 2012 Iconic brand with 100+ years of history Superior mix of products Industry leader in volume, revenue and margin share 18 |
|
|
Batesville’s strategy is to optimize the casket business, capitalize on growth opportunities and sustain margins Optimize the Profitable Casket Business Maintain Attractive Margins Capitalize on Growth Opportunities New product development Merchandising/sales Options cremation products Batesville Interactive – software solutions for funeral directors Operational excellence Lean manufacturing and distribution Continuous improvement in all business processes 19 |
|
|
Batesville has predictable strong cash flow and attractive margins Industry Dynamics Attractive Financials Deaths expected to increase in the future as baby boomers age North American cremation rate is currently ~ 43% and increasing approximately 120-140 basis points per year Increase in future deaths expected to be offset by cremation, resulting in relatively flat burial market Historically high return on invested capital (in excess of 60%) Unusual decline in deaths in 2012 decreased demand for burial caskets, putting downward pressure on margins Adjusted margins* improved in FY13 Relentless focus on lean to maintain attractive margins Adj EBITDA* and Margins ($ Millions) Estimated Deaths (Millions) * See Appendix for reconciliation 20 |
|
|
Financial Results 21 |
|
|
Third quarter revenue grew 72% and adjusted EBITDA* grew 43% on the strong contribution from the Coperion acquisition and solid Batesville performance Hillenbrand Q3 2013 Results – THREE MONTHS ENDED JUNE 30 $ in millions (except EPS) Q3 FY13 Q3 FY12 Net Revenue % Year-Over-Year Growth $408.8 71.5% $238.4 12.9% EBITDA (Adjusted)* % of Revenue $63.7 15.6% $44.7 18.8% EPS (Adjusted)* $0.48 $0.37 Free Cash Flow* $23 $44 Coperion acquisition drove 181% Process Equipment Group revenue growth Backlog increased 5% sequentially to $571 million Non-Coperion PEG revenue declined 2% due to the expected reduction in demand for frac sand equipment Excluding the impact of proppants equipment, non-Coperion PEG revenue grew 11% Batesville revenue grew 2% as increase in average selling price more than offset reduced burial demand Adjusted EBITDA* increased 43% Adjusted EBITDA* margin percentage change due to impact of Coperion’s business model ~1/3 revenue from 3rd party –sourced products (small up-charge) ~2/3 revenue from proprietary equipment and parts & service has attractive adjusted gross margin* percentage (35+%) Free cash flow* variance driven by: $11 million pension funding Investment in working capital and acquisition costs related to Coperion * See Appendix for reconciliation 22 |
|
|
Our year-to-date results reflect a strong contribution from the Coperion acquisition, with 52% increase in net revenue Hillenbrand YTD 2013 Results – NINE MONTHS ENDED JUNE 30 $ in millions (except EPS) YTD Q3 FY13 YTD Q3 FY12 Net Revenue % Year-Over-Year Growth $1,113 52.5% $730 11.9% EBITDA (Adjusted)* % of Revenue $179 16.1% $151 20.7% EPS (Adjusted)* $1.38 $1.26 Free Cash Flow* $32 $96 Net Debt** $670 $258 Coperion acquisition drove 134% Process Equipment Group revenue growth Non-Coperion PEG declined 8% due to: Reduced demand for proppants and potash equipment Unusually large equipment sale in Q2 2012 Non-Coperion PEG revenue expected to be slightly down year-over-year Batesville revenue grew 3% during the first nine months driven by increased burial volume resulting from increased number of deaths Adjusted EBITDA* margin percentage change due to impact of Coperion’s business model ~1/3 revenue from 3rd party –sourced products (small up-charge) ~2/3 revenue from proprietary equipment and parts & service has attractive adjusted gross margin* percentage (35+%) Free cash flow* variance driven by: Investment in Coperion working capital $14 million acquisition costs $15 million pension funding $5 million to close legacy antitrust litigation * See Appendix for reconciliation ** Net Debt is Total Debt less Cash 23 |
|
|
Hillenbrand has a history of strong financial performance... FY10 includes K-Tron acquisition ($369 m Net purchase price) * *See Appendix for reconciliation 24 |
|
|
...which fuels a capital deployment strategy that focuses on creating shareholder value Reinvestment for long-term growth Organic growth investments Acquisitions Meaningful dividend $0.77 per share in 2012 (46% payout ratio) Annual $0.01 increase per share per year (5 consecutive years) Attractive dividend yield: 3.1% (8/12/13) Reinvestment for Long-Term Growth Working Capital and CapEx Dividends 25 |
|
|
We expect attractive revenue and earnings growth for the full year Accretion from Coperion > $0.20 PEG revenue ~ $1 billion; > 60% of global revenue Batesville revenue ~ $600 million 2013 Guidance Summary 2012 2013 Revenue (millions) $983 $1,600 Adjusted EPS* $1.76 $1.82 - $1.92 * FY12 adjusted EPS includes $0.13 of favorable items that won’t repeat (e.g. changes to employee compensation and benefits, taxes and other estimates) * FY13 adjusted EPS includes $0.12 of intangible asset amortization from the Coperion acquisition * See Appendix for reconciliation 26 |
|
|
Hillenbrand is an attractive investment opportunity Market leading platforms with robust cash generation Strong balance sheet and cash flow Process Equipment Group represents ~2/3 of Hillenbrand revenue with attractive organic mid to high single-digit growth expected Bottom-line growth enhanced by leveraging core competencies Meaningful return of cash to shareholders, including an attractive dividend yield Annual dividend increases since HI inception (2008) Strong Financial Profile Growth Opportunity Compelling Dividend Proven Track Record Demonstrated acquisition success Proven, results-oriented management teams Strong core competencies in lean business, strategy management and talent development 27 |
|
|
Questions? 28 |
|
|
Appendix |
|
|
Disclosure regarding non-GAAP measures While we report financial results in accordance with accounting principles generally accepted in the United States (GAAP), we also provide certain non-GAAP operating performance measures. These non-GAAP measures are referred to as “adjusted” and exclude expenses associated with backlog amortization, inventory step-up, business acquisitions, restructuring, and antitrust litigation. The measures also exclude the tax benefit of the international integration in fiscal year 2012 and expenses associated with long-term incentive compensation related to the international integration. The related income tax for all of these items is also excluded. This non-GAAP information is provided as a supplement, not as a substitute for, or as superior to, measures of financial performance prepared in accordance with GAAP. A non-GAAP measure that we use is Adjusted Earnings Before Interest, Income Tax, Depreciation, and Amortization (“Adjusted EBITDA”). As previously discussed, our strategy is to selectively acquire companies which can benefit from our core competencies to spur faster and more profitable growth. Given that strategy, it is a natural consequence to incur related expenses, such as amortization from acquired intangible assets and additional interest expense from debt-funded acquisitions. Accordingly, we use Adjusted EBITDA, among other measures, to monitor our business performance. We use this information internally to make operating decisions and believe it is helpful to investors because it allows more meaningful period-to-period comparisons of our ongoing operating results. The information can also be used to perform trend analysis and to better identify operating trends that may otherwise be masked or distorted by these types of items. Finally, the Company believes such information provides a higher degree of transparency for certain items. 30 |
|
|
Q3 FY13 & Q3 FY12 - Consolidated net income to adjusted EBITDA reconciliation ($ in millions) 31 2013 2012 Consolidated net income 13.7 $ 21.3 $ Interest income - (0.1) Interest expense 5.9 3.0 Income tax expense 5.8 8.6 Depreciation and amortization 27.4 9.4 EBITDA 52.8 $ 42.2 $ Inventory step-up 8.0 - Business acquisition 2.4 0.2 Restructuring 0.3 2.3 Other 0.2 - Long-term incentive compensation related to the international integration - - Adjusted EBITDA 63.7 $ 44.7 $ Quarter Ended June 30, |
|
|
YTD FY13 and FY12 - Consolidated net income to adjusted EBITDA reconciliation ($ in millions) 32 2013 2012 Consolidated net income 41.5 $ 80.0 $ Interest income (0.3) (0.4) Interest expense 17.2 8.8 Income tax expense 17.0 20.6 Depreciation and amortization 70.3 31.0 EBITDA 145.7 $ 140.0 $ Inventory step-up 18.7 - Business acquisition 12.4 1.2 Restructuring 2.2 7.0 Other 0.3 0.5 Long-term incentive compensation related to the international integration - 2.2 Adjusted EBITDA 179.3 $ 150.9 $ Nine Months Ended June 30, |
|
|
Q2 FY13 & Q2 FY12 - Consolidated net income to adjusted EBITDA reconciliation ($ in millions) 33 2013 2012 Consolidated net income 13.2 $ 27.4 $ Interest income (0.2) (0.1) Interest expense 6.8 2.8 Income tax expense 5.3 13.3 Depreciation and amortization 27.8 9.5 EBITDA 52.9 $ 52.9 $ Antitrust litigation - 0.1 Inventory step-up 8.1 - Business acquisition 1.8 0.5 Restructuring 1.3 4.7 Long-term incentive compensation related to the international integration - - Adjusted EBITDA 64.1 $ 58.2 $ Quarter Ended March 31, |
|
|
Q1 FY13 & Q1 FY12 - Consolidated net income to adjusted EBITDA reconciliation ($ in millions) 34 2012 2011 Consolidated net income 14.6 $ 31.3 $ Interest income (0.1) (0.2) Interest expense 4.5 2.9 Income tax expense 5.9 (1.3) Depreciation and amortization 15.0 12.2 EBITDA 39.9 $ 44.9 $ Antitrust litigation 0.1 0.4 Inventory step-up 2.6 - Business acquisition 8.2 0.5 Restructuring 0.6 - Long-term incentive compensation related to the international integration - 2.2 Adjusted EBITDA 51.4 $ 48.0 $ Quarter Ended December 31, |
|
|
Consolidated net income to adjusted EBITDA reconciliation ($ in millions) 35 2012 2011 2010 2009 Consolidated net income 104.8 $ 106.1 $ 92.3 $ 102.3 $ Interest income (0.5) (7.4) (13.0) (14.1) Interest expense 12.4 11.0 4.2 2.1 Income tax expense 30.1 51.7 54.1 58.5 Depreciation and amortization 40.4 36.1 28.2 18.5 EBITDA 187.2 $ 197.5 $ 165.8 $ 167.3 $ Antitrust litigation 5.5 1.3 5.0 2.2 Inventory step-up - 2.8 11.6 - Business acquisition 4.2 6.3 10.5 - Sales tax recoveries - (0.8) (4.7) - Restructuring 8.3 1.3 3.0 0.1 Long-term incentive compensation related to the international integration 2.2 - - - Adjusted EBITDA 207.4 $ 208.4 $ 191.2 $ 169.6 $ Years Ended September 30, |
|
|
Non-GAAP Operating Performance Measures ($ in millions) 36 GAAP Adj Adjusted GAAP Adj Adjusted GAAP Adj Adjusted GAAP Adj Adjusted Cost of goods sold 194.6 $ (3.0) $ (a) 191.6 $ 261.9 $ (9.7) $ (e) 252.2 $ 273.7 $ (8.6) $ (h) 265.1 $ 730.2 $ (21.3) $ (k) 708.9 $ Operating expenses 86.5 (13.6) (b) 72.9 111.0 (15.2) (f) 95.8 109.4 (15.6) (i) 93.8 306.9 (44.4) (l) 262.5 Interest expense 4.5 - 4.5 6.8 (0.6) (g) 6.2 5.9 (0.5) (j) 5.4 17.2 (1.1) (m) 16.1 Other income (expense), net 0.9 (0.9) (c) - (0.3) - (0.3) (0.3) (0.2) (0.5) 0.3 (1.1) (n) (0.8) Income tax expense 5.9 4.2 (d) 10.1 5.3 7.6 (d) 12.9 5.8 7.4 (d) 13.2 17.0 19.2 (d) 36.2 Net income 1 14.3 11.5 25.8 12.7 17.9 30.6 13.3 17.1 30.4 40.3 46.5 86.8 Diluted EPS 0.23 0.18 0.41 0.20 0.29 0.49 0.21 0.27 0.48 0.64 0.74 1.38 1 Net income attributable to Hillenbrand P = Process Equipment Group; B = Batesville; C = Corporate (a) Inventory step up ($2.6 P), restructuring ($0.1 P, $0.3 B) (b) Business acquisition costs ($9.0 C), backlog amortization ($4.2 P), restructuring ($0.2 C), other ($0.2 B) (c) Acquisition-related foreign currency transactions ($0.8 C), other ($0.1 B) (d) Tax effect of adjustments (e) Inventory step up ($8.1 P), restructuring ($0.1 P, $1.5 B) (f) Business acquisition costs ($0.3 P, $1.6 C), backlog amortization ($12.9 P), restructuring ($0.4 B) (g) Business acquisition costs ($0.6 C) (h) Inventory step up ($8.0 P), restructuring ($0.1 P, $0.5 B) (i) Business acquisition costs ($1.0 P, $1.5 C), backlog amortization ($12.8 P), restructuring ($0.2 P), other ($0.1B) (j) Business acquisition costs ($0.5 C) (k) Inventory step up ($18.7 P), restructuring ($0.3 P, $2.3 B) (l) Business acquisition costs ($1.3 P, $12.1 C), backlog amortization ($29.9 P), restructuring ($0.2 P, $0.5 B, $0.2 C), antitrust litigation ($0.1 B), other ($0.1 B) (m) Business acquisition costs ($1.1 C) (n) Acquisition-related foreign currency transactions ($0.8 C), business acquisition costs ($0.2 C), other ($0.1 B) Three months ended March 31, 2013 Nine months ended June 30, 2013 Three months ended December 31, 2012 Three months ended June 30, 2013 |
|
|
Non-GAAP Operating Performance Measures ($ in millions) 37 Adj GAAP Adj Adj GAAP Adj $ 594.3 $ (4.2) (a) $ 590.1 $ 513.5 $ (2.8) (b) $ 510.7 $ 435.9 $ (11.6) (b) $ 424.3 $ 374.7 $ - $ 374.7 240.1 (18.8) (c) 221.3 211.3 (8.9) (d) 202.4 175.4 (15.5) (e) 159.9 119.4 (2.3) (f) 117.1 30.1 18.1 (g) 48.2 51.7 4.0 (h) 55.7 54.1 7.8 (h) 61.9 58.5 0.8 (h) 59.3 4.9 7.7 19.3 1.5 1.68 0.08 1.76 1.71 0.13 1.84 1.49 0.31 1.80 1.66 0.02 1.68 1 Net income attributable to Hillenbrand (a) Restructuring ($0.9 P, $3.3 B) (b) Inventory step-up (FY2011: $2.8 P, FY2010: $11.6 P) (c) (d) Restructuring ($1.3 B), antitrust litigation ($1.3 B), business acquisition costs ($0.3 P, $6.0 C), backlog amortization ($0.8 P), and sales tax recoveries ($0.8 B) (e) Business acquisition costs ($0.3 P, $10.2 C), antitrust litigation ($5.0 B), restructuring ($3.0 C), backlog ($1.7 P), and sales tax recoveries ($4.7 B) (f) Antitrust litigation ($2.2 B), restructuring ($0.1 C) (g) (h) Tax effect of adjustments Years Ended September 30, 2012 2011 2010 2009 Adjusted Adjusted Cost of goods sold Operating expenses GAAP Adjusted Adjusted GAAP Income tax expense Net income 1 104.8 106.1 109.7 113.8 111.6 92.3 P = Process Equipment Group; B = Batesville; C = Corporate Tax benefit of the international integration ($10.4) and tax effect of adjustments ($7.7) Antitrust litigation ($5.5 B), restructuring ($2.8 P, $0.6 B, $0.9 C), business acquisition costs ($4.2 C), backlog amortization ($2.5 P), long-term incentive compensation related to the international integration ($0.2 P, $0.8 B, $1.2 C), and other ($0.1 C) 103.8 Diluted EPS 102.3 |
|
|
Q3 FY13 & Q3 FY12 - Cash Flow Information ($ in millions) 38 Operating Activities 2013 2012 Net Income 13.7 $ 21.3 $ Depreciation and amortization 27.4 9.3 Change in working capital (1.7) 16.3 Other, net (8.3) 2.6 Net cash provided by operating activities (A) 31.1 $ 49.5 $ Capital expenditures (B) (7.9) (5.9) Acquisition of businesses, net of cash acquired (0.1) - Debt activity (11.4) (74.0) Dividends (12.2) (12.0) Other 0.9 (1.7) Net change in cash 0.4 $ (44.1) $ Free Cash Flow (A-B) 23.2 $ 43.6 $ Quarter Ended June 30, |
|
|
YTD FY13 and FY12 - Cash Flow Information ($ in millions) 39 Operating Activities 2013 2012 Net Income 41.5 $ 80.0 $ Depreciation and amortization 70.3 31.0 Change in working capital 0.1 5.0 Other, net (61.1) (6.4) Net cash provided by operating activities (A) 50.8 $ 109.6 $ Capital expenditures (B) (19.1) (14.0) Acquisition of businesses, net of cash acquired (415.7) - Debt activity 437.3 (158.0) Dividends (36.5) (35.8) Other 4.1 (1.3) Net change in cash 20.9 $ (99.5) $ Free Cash Flow (A-B) 31.7 $ 95.6 $ Nine Months Ended June 30, |
|
|
Q2 FY13 & Q2 FY12 - Cash Flow Information ($ in millions) 40 Operating Activities 2013 2012 Net Income 13.2 $ 27.4 $ Depreciation and amortization 27.9 9.5 Change in working capital (11.1) (9.7) Other, net (30.0) 5.9 Net cash provided by operating activities (A) - $ 33.1 $ Capital expenditures (B) (5.6) (3.9) Acquisition of businesses, net of cash acquired - - Debt activity (46.1) (84.0) Dividends (12.2) (11.9) Other 2.5 4.3 Net change in cash (61.4) $ (62.4) $ Free Cash Flow (A-B) (5.6) $ 29.2 $ Quarter Ended March 31, |
|
|
Q1 FY13 & Q1 FY12 - Cash Flow Information ($ in millions) 41 Operating Activities 2012 2011 Net Income 14.6 $ 31.3 $ Depreciation and amortization 15.0 12.2 Change in working capital 12.9 (1.6) Other, net (22.8) (14.9) Net cash provided by operating activities (A) 19.7 $ 27.0 $ Capital expenditures (B) (5.6) (4.2) Acquisition of businesses, net of cash acquired (415.6) - Debt activity 494.8 - Dividends (12.1) (11.9) Other 0.7 (3.9) Net change in cash 81.9 $ 7.0 $ Free Cash Flow (A-B) 14.1 $ 22.8 $ Quarter Ended December 31, |
|
|
Cash Flow Information ($ in millions) 42 Operating Activities 2012 2011 2010 2009 Net Income 104.8 $ 106.1 $ 92.3 $ 102.3 $ Depreciation and amortization 40.4 36.1 28.2 18.5 Interest income on Forethought Note - (6.4) (12.0) (12.4) Forethought Note interest payment - 59.7 10.0 - Change in working capital (19.8) (16.4) 16.9 6.5 Other, net 12.8 10.4 (17.2) 8.3 Net cash provided by operating activities (A) 138.2 $ 189.5 $ 118.2 $ 123.2 $ Capital expenditures (B) (20.9) (21.9) (16.3) (10.0) Forethought Note principal repayment - 91.5 - - Acquisition of businesses, net of cash acquired (4.4) (240.9) (371.5) - Proceeds from redemption and sales, and ARS and investments 0.8 12.4 37.2 2.3 Debt activity (162.3) 28.1 334.2 (40.0) Dividends (47.6) (46.9) (46.2) (45.6) Purchase of common stock - (3.8) - (12.5) Other 0.9 9.1 7.6 3.1 Net change in cash (95.3) $ 17.1 $ 63.2 $ 20.5 $ Free Cash Flow (A-B) 117.3 $ 167.6 $ 101.9 $ 113.2 $ Years Ended September 30, |