Exhibit 99.1
|
|
Platforms for Growth |

Exhibit 99.1
|
|
Platforms for Growth |
|
|
Throughout this presentation, we make a number of forward-looking statements within the meaning of the Private Securities Litigation Reform Act of 1995. As the words imply, forward-looking statements are statements about the future, as contrasted with historical information. Our forward-looking statements are based on assumptions and current expectations of future events that we believe are reasonable, but by their very nature they are subject to a wide range of risks. If our assumptions prove inaccurate or unknown risks and uncertainties materialize, actual results could vary materially from Hillenbrand’s expectations and projections. Words that could indicate we’re making forward-looking statements include the following: This is not an exhaustive list. Our intent is to provide examples of how readers might identify forward-looking statements. The absence of any of these words, however, does not mean that the statement is not forward-looking. Here’s the key point: Forward-looking statements are not guarantees of future performance, and our actual results could differ materially from those set forth in any forward-looking statements. Any number of factors, many of which are beyond our control, could cause our performance to differ significantly from what is described in the forward-looking statements. These factors include, but are not limited to: the outcome of any legal proceedings that may be instituted against Hillenbrand, or any companies we may acquire; risks that an acquisition disrupts current operations or poses potential difficulties in employee retention or otherwise affects financial or operating results; the ability to recognize the benefits of an acquisition, including potential synergies and cost savings or the failure of an acquired company to achieve its plans and objectives generally; global market and economic conditions, including those related to the credit markets; volatility of our investment portfolio; adverse foreign currency fluctuations; ongoing involvement in claims, lawsuits and governmental proceedings related to operations; labor disruptions; the dependence of our business units on relationships with several large providers; increased costs or unavailability of raw materials; continued fluctuations in mortality rates and increased cremations; competition from nontraditional sources in the funeral services business; cyclical demand for industrial capital goods; and certain tax-related matters. For a more in-depth discussion of these and other factors that could cause actual results to differ from those contained in forward-looking statements, see the discussions under the heading “Risk Factors” in item 1A of Hillenbrand’s Form 10-Q for the quarter ended March 31, 2013, filed with the Securities and Exchange Commission (SEC) May 8, 2013. Hillenbrand assumes no obligation to update or revise any forward-looking information as a result of new information or future events or developments. Disclosure regarding forward-looking statements 2 |
|
|
3 Agenda Hillenbrand a global diversified industrial company Process Equipment Group (PEG) our high-growth business platform Batesville our time-tested and highly profitable market leader Select Financial Results |
|
|
Hillenbrand Profile |
|
|
Hillenbrand began as a funeral products company and has diversified through acquisitions Leading global providers of compounding and extrusion equipment, bulk solids material handling equipment and systems for a wide variety of manufacturing and other industrial processes Serves customers through four operating companies: Coperion - Compounding & extrusion equipment, materials handling equipment, system solutions, parts and services K-Tron – Feeding and pneumatic conveying equipment, parts and services TerraSource Global– Size reduction equipment, conveying systems and screening equipment, parts and services ROTEX – Dry material separation machines and replacement parts and accessories Founded in 1906 and dedicated for more than 100 years to helping families honor the lives of those they love® North American leader in funeral products due to a history of manufacturing excellence, product innovation, superior customer service, and reliable delivery 2007 2008 2009 2010 Hillenbrand Industries approves the separation of Hill-Rom and Batesville Casket into two independent publicly traded companies Hillenbrand, Inc. (parent of Batesville Casket Company) begins operation April 1, 2008 K-Tron Acquisition (includes TerraSource) April 1, 2010 Batesville Process Equipment Group 2011 Rotex acquisition September 1, 2011 2012 Coperion acquisition December 3, 2012 5 |
|
|
Our strategy is to leverage our strengths and core competencies to diversify and grow profitably 6 Leverage our strong financial foundation and core competencies to create a global diversified industrial company Goals for Creating Shareholder Value • Grow organically and through acquisitions • Maintain strong balance sheet and superior cash generation Strategy Management Lean Business Intentional Talent Development Focus on long-term objectives that generate the greatest competitive advantage Flow value to the customer, drive out waste and pursue perfection to deliver superior results Recruit and retain top talent by providing key employees with development opportunities that stretch their abilities Stable Cash Flow and Earnings • Culture of Execution • Experienced Management Team Criteria for future acquisition candidates include: Attractive margins, strong cash generation and multiple pathways for growth Good market positions, strong brand and good growth prospects in its defined space Strong strategic fit with Hillenbrand Ability to benefit from our core competencies and share its own competitive strengths |
|
|
Implementing this strategy has led to robust revenue growth from two attractive platforms 7 TerraSource History of annual double digit organic growth (13% in 2012) Parts and service revenue ~ 1/3 of total Diversified revenue sources Multiple pathways/end markets for growth Process Equipment Group Adj EBITDA* margin > 25% Strong, predictable cash flow Batesville 25% CAGR *See Appendix for reconciliation 15% CAGR |
|
|
8 The transformation of Hillenbrand has resulted in diversification by geography and platform Hillenbrand Revenue Mix by Geography Hillenbrand Revenue Mix by Platform Domestic |
|
|
and we expect continued attractive growth 9 $ .6 Billion 2013 Guidance 2017 Vision 2009 $1.6 Billion Organic Revenue 25% CAGR 60% Process Equipment 40% Funeral Products Double digit growth targets 100% Funeral Products PEG will continue to become a larger portion of our portfolio due to higher growth than Batesville Additional growth from acquisitions |
|
|
Hillenbrand is an attractive investment opportunity 10 Market leading platforms with robust cash generation Strong balance sheet and cash flow Process Equipment Group represents 2/3 of Hillenbrand revenue with attractive organic mid to high single-digit growth expected Bottom-line growth enhanced by leveraging core competencies Meaningful return of cash to shareholders, including an attractive dividend yield Annual dividend increases since HI inception (2008) Strong Financial Profile Growth Opportunity Compelling Dividend Proven Track Record Demonstrated acquisition success Proven, results-oriented management teams Strong core competencies in lean business, strategy management and talent development |
|
|
Process Equipment Group Overview |
|
|
Our Process Equipment Group companies manufacture world-class industrial equipment 12 2010 2011 2012 Rotex Screening equipment Separating equipment Crushers Biomass handling equipment Feeders Pneumatic conveying equipment System solutions TerraSource Global K-Tron Compounding & extrusion equipment Materials handling equipment System solutions Coperion Year acquired |
|
|
Process Equipment Group’s strategy provides compelling growth opportunities and Coperion accelerates every dimension 13 K-Tron Rotex Terra Source Coperion $ Accelerated global expansion Improved access to underpenetrated geographies Expands ability to operate & grow globally Accelerated revenue growth PEG products in Coperion Systems Improves combined entity’s ability to succeed in penetrating large, growing end markets Enhanced system capabilities Access to new customers and selling channels Improved margins Lean business practices Strong PEG market positions leverage macro trends: Global population growth Rising demand for food and energy Expansion of the middle class |
|
|
Revenue Mix by Type* Process Equipment Group’s revenue is highly diversified by end market and geography 14 Revenue Mix by Geography* Revenue Mix by Industry* Parts & Service** Machines **Stable revenue and attractive margins * FY 2013 ESTIMATE |
|
|
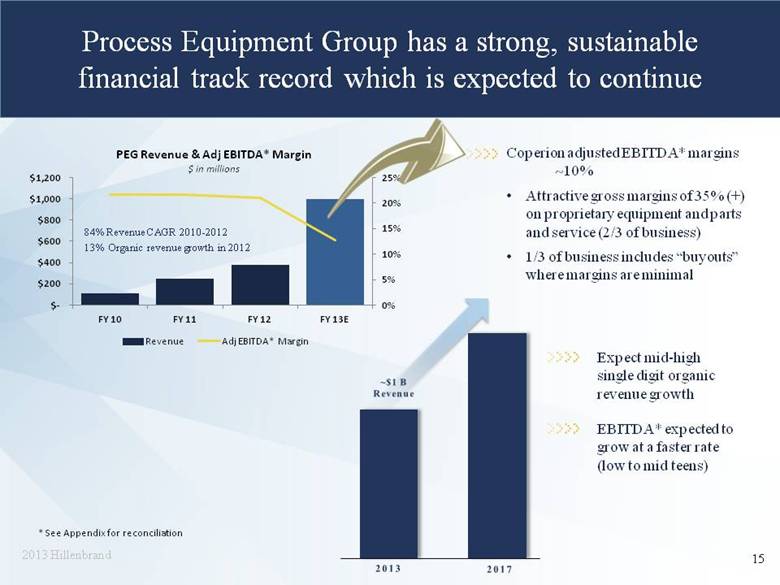
Process Equipment Group has a strong, sustainable financial track record which is expected to continue 15 Expect mid-high single digit organic revenue growth EBITDA* expected to grow at a faster rate (low to mid teens) * See Appendix for reconciliation Coperion adjusted EBITDA* margins ~10% Attractive gross margins of 35% (+) on proprietary equipment and parts and service (2/3 of business) 1/3 of business includes “buyouts” where margins are minimal 84% Revenue CAGR 2010-2012 13% Organic revenue growth in 2012 |
|
|
Batesville Overview |
|
|
Other (100+) Batesville Importers Aurora Matthews Caskets Market Leader Grave Markers Not in Market Cremation Market Leader Vaults Not in Market Batesville is the leading player in the largest and most profitable segment of the North American funeral products industry 17 Batesville Caskets North American Funeral Products ($2.6 Billion Industry) North American Caskets (Total Revenue $1.3 Billion) Batesville (Total 2012 Revenue: $607 Million) Other, including Options, Batesville Interactive and Northstar Source: Company estimates, industry reports and public filings for FY 2012 |
|
|
Batesville’s strategy is to optimize the casket business, capitalize on growth opportunities and sustain margins 18 Optimize the Profitable Casket Business Maintain Attractive Margins Capitalize on Growth Opportunities New product development Merchandising/sales Options cremation products Batesville Interactive – software solutions for funeral directors Operational excellence Lean manufacturing and distribution Continuous improvement in all business processes |
|
|
19 Batesville has sustainable strong cash flow and attractive margins Industry Dynamics Attractive Financials Deaths expected to increase in the future as “baby boomers” age North American cremation rate is currently ~ 40% and increasing at an upward trend of approximately 120-140 basis points per year Increase in future deaths expected to be offset by cremation, resulting in relatively flat burial market Historically high return on invested capital (in excess of 50%) Unusual decline in deaths in 2012 decreased demand for burial caskets, putting downward pressure on margins Relentless focus on lean to maintain attractive margins Adj EBITDA* and Margins ($ Millions) Estimated Deaths (Millions) * See Appendix for reconciliation |
|
|
Financial Results |
|
|
21 Our year-to-date results reflect a strong contribution from the Coperion acquisition, with 43% increase in net revenue Hillenbrand YTD 2013 Results – SIX MONTHS ENDED MARCH 31 $ in millions (except EPS) YTD Q2 FY13 YTD Q2 FY12 Net Revenue % Year-Over-Year Growth $704 43.2% $491 11.4% EBITDA (Adjusted)* % of Revenue $116 16.4% $106 21.6% EPS (Adjusted)* $0.90 $0.89 Free Cash Flow* $9 $52 Coperion acquisition drove 110% Process Equipment Group revenue growth Organic PEG declined 11% due to: Reduced demand for frac sand and potash equipment Unusually large equipment sale in Q2 2012 Full year 2013 organic PEG revenue expected to be flat to slightly down year-over-year Batesville revenue grew 4% during the first six months driven by increased burial volume resulting from higher deaths Adjusted EBITDA* margin % decrease was expected due to higher proportion of lower margin, third-party-sourced products in Coperion’s business model (which partially offsets the high margins from their proprietary equipment and parts and service) Free cash flow* variance driven by investment in Coperion working capital, $11 million in acquisition costs and $5 million related to closing legacy antitrust litigation * See Appendix for reconciliation |
|
|
Attractive revenue and earnings growth is expected for the full year 22 Accretion from Coperion > $0.20 PEG revenue ~$1 billion; > 60% of global revenue Batesville revenue ~ $600 million 2013 Guidance Summary 2012 2013 Revenue (millions) $983 $1,600 Adjusted EPS* $1.76 $1.82 - $1.92 * FY12 adjusted EPS includes $0.13 of favorable items that won’t repeat (e.g. changes to employee compensation and benefits, taxes and other estimates) * FY13 adjusted EPS includes $0.12 of intangible asset amortization from the Coperion acquisition See Appendix for reconciliation |
|
|
Hillenbrand has a history of strong financial performance 23 FY10 includes K-Tron acquisition ($369 m Net Purchase price) * * See Appendix for reconciliation *See Appendix for reconciliation |
|
|
which fuels a capital deployment strategy that focuses on creating shareholder value 24 Reinvestment for long-term growth Organic growth investments Acquisitions Meaningful dividend $0.77 per share in 2012 (46% payout ratio) Annual $0.01 increase per share per year (5 consecutive years) Attractive dividend yield: 3.2% (5/29/13) Reinvestment for Long-Term Growth Working Capital and CapEx Dividends |
|
|
Hillenbrand is an attractive investment opportunity 25 Market leading platforms with robust cash generation Strong balance sheet and cash flow Process Equipment Group represents 2/3 of Hillenbrand revenue with attractive organic mid to high single-digit growth expected Bottom-line growth enhanced by leveraging core competencies Meaningful return of cash to shareholders, including an attractive dividend yield Annual dividend increases since HI inception (2008) Strong Financial Profile Growth Opportunity Compelling Dividend Proven Track Record Demonstrated acquisition success Proven, results-oriented management teams Strong core competencies in lean business, strategy management and talent development |
|
|
Back-up |
|
|
27 Hillenbrand Q2 2013 Results Net revenue increased 53% as both platforms achieved attractive growth SECOND QUARTER ENDED MARCH 31 $ in millions (except EPS) Q2 FY13 Q2 FY12 Net Revenue % Year-Over-Year Growth $399 53.4% $260 12.9% EBITDA (Adjusted)* % of Revenue $64 16.1% $58 22.4% EPS (Adjusted)* $0.49 $0.50 Free Cash Flow* ($6) $29 Coperion acquisition drove 136% Process Equipment Group revenue growth Organic PEG declined 18% due to: Reduced demand for frac sand and potash equipment Unusually large equipment sale in Q2 2012 Full year 2013 organic PEG revenue expected to be flat to slightly down year-over-year Batesville revenue grew 5%, driven by increased burial volume resulting from higher deaths EBITDA margin % decrease was expected due to higher proportion of lower margin, third-party-sourced products in Coperion’s business model Negative free cash flow* driven by investment in Coperion working capital and $3 million in acquisition costs * See Appendix for reconciliation. |
|
|
Appendix |
|
|
29 Disclosure regarding non-GAAP measures While we report financial results in accordance with accounting principles generally accepted in the United States (GAAP), we also provide certain non-GAAP operating performance measures. These non-GAAP measures exclude the tax benefit of the international integration described in Item 7 of our 2012 Form 10-K filed with the Securities and Exchange Commission (SEC) November 26, 2012 , expenses associated with long-term incentive compensation related to the international integration, backlog amortization, antitrust litigation, business acquisitions, restructuring, and sales tax adjustments, as well as the related income tax. This non-GAAP information is provided as a supplement, not as a substitute for, or as superior to, measures of financial performance prepared in accordance with GAAP. We use this information internally to make operating decisions and believe it is helpful to investors because it allows more meaningful period-to-period comparisons of our ongoing operating results. The information can also be used to perform trend analysis and to better identify operating trends that may otherwise be masked or distorted by these types of items. Finally, the Company believes such information provides a higher degree of transparency for certain items. Investors should consider non-GAAP measures in addition to, not as a substitute for, or as superior to, measures of financial performance prepared in accordance with GAAP. |
|
|
30 Consolidated net income to adjusted EBITDA reconciliation ($ in millions) 2012 2011 2010 2009 Consolidated net income 104.8 $ 106.1 $ 92.3 $ 102.3 $ Interest income (0.5) (7.4) (13.0) (14.1) Interest expense 12.4 11.0 4.2 2.1 Income tax expense 30.1 51.7 54.1 58.5 Depreciation and amortization 40.4 36.1 28.2 18.5 EBITDA 187.2 $ 197.5 $ 165.8 $ 167.3 $ Antitrust litigation 5.5 1.3 5.0 2.2 Inventory step-up - 2.8 11.6 - Business acquisition 4.2 6.3 10.5 - Sales tax recoveries - (0.8) (4.7) - Restructuring 8.3 1.3 3.0 0.1 Long-term incentive compensation related to the international integration 2.2 - - - Adjusted EBITDA 207.4 $ 208.4 $ 191.2 $ 169.6 $ Years Ended September 30, |
|
|
31 Q1 FY13 & Q1 FY12 - Consolidated net income to adjusted EBITDA reconciliation ($ in millions) 2012 2011 Consolidated net income 14.6 $ 31.3 $ Interest income (0.1) (0.2) Interest expense 4.5 2.9 Income tax expense 5.9 (1.3) Depreciation and amortization 15.0 12.2 EBITDA 39.9 $ 44.9 $ Antitrust litigation 0.1 0.4 Inventory step-up 2.6 - Business acquisition 8.2 0.5 Restructuring 0.6 - Long-term incentive compensation related to the international integration - 2.2 Adjusted EBITDA 51.4 $ 48.0 $ Quarter Ended December 31, |
|
|
32 Q2 FY13 & Q2 FY12 - Consolidated net income to adjusted EBITDA reconciliation ($ in millions) 2013 2012 Consolidated net income 13.2 $ 27.4 $ Interest income (0.2) (0.1) Interest expense 6.8 2.8 Income tax expense 5.3 13.3 Depreciation and amortization 27.8 9.5 EBITDA 52.9 $ 52.9 $ Antitrust litigation - 0.1 Inventory step-up 8.1 - Business acquisition 1.8 0.5 Restructuring 1.3 4.7 Long-term incentive compensation related to the international integration - - Adjusted EBITDA 64.1 $ 58.2 $ Quarter Ended March 31, |
|
|
33 YTD FY13 and FY12 - Consolidated net income to adjusted EBITDA reconciliation ($ in millions) 2013 2012 Consolidated net income 27.8 $ 58.7 $ Interest income (0.3) (0.3) Interest expense 11.3 5.7 Income tax expense 11.2 12.0 Depreciation and amortization 42.9 21.7 EBITDA 92.9 $ 97.8 $ Antitrust litigation 0.1 0.5 Inventory step-up 10.7 - Business acquisition 10.0 1.0 Restructuring 1.9 4.7 Long-term incentive compensation related to the international integration - 2.2 Adjusted EBITDA 115.6 $ 106.2 $ Six Months Ended March 31, |
|
|
34 Non-GAAP Operating Performance Measures ($ in millions) Adj GAAP Adj Adj GAAP Adj $ 594.3 $ (4.2) (a) $ 590.1 $ 513.5 $ (2.8) (b) $ 510.7 $ 435.9 $ (11.6) (b) $ 424.3 $ 374.7 $ - $ 374.7 388.9 4.2 393.1 369.9 2.8 372.7 313.3 11.6 324.9 274.4 - 274.4 240.1 (18.8) (c) 221.3 211.3 (8.9) (d) 202.4 175.4 (15.5) (e) 159.9 119.4 (2.3) (f) 117.1 148.8 23.0 171.8 158.6 11.7 170.3 137.9 27.1 165.0 155.0 2.3 157.3 30.1 18.1 (g) 48.2 51.7 4.0 (h) 55.7 54.1 7.8 (h) 61.9 58.5 0.8 (h) 59.3 4.9 7.7 19.3 1.5 1.68 0.08 1.76 1.71 0.13 1.84 1.49 0.31 1.80 1.66 0.02 1.68 1 Net income attributable to Hillenbrand (a) Restructuring ($0.9 P, $3.3 B) (b) Inventory step-up (FY2011: $2.8 P, FY2010: $11.6 P) (c) (d) Restructuring ($1.3 B), antitrust litigation ($1.3 B), business acquisition costs ($0.3 P, $6.0 C), backlog amortization ($0.8 P), and sales tax recoveries ($0.8 B) (e) Business acquisition costs ($0.3 P, $10.2 C), antitrust litigation ($5.0 B), restructuring ($3.0 C), backlog ($1.7 P), and sales tax recoveries ($4.7 B) (f) Antitrust litigation ($2.2 B), restructuring ($0.1 C) (g) (h) Tax effect of adjustments P = Process Equipment Group; B = Batesville; C = Corporate Tax benefit of the international integration ($10.4) and tax effect of adjustments Antitrust litigation ($5.5 B), restructuring ($2.8 P, $0.6 B, $0.9 C), business acquisition costs ($4.2 C), backlog amortization ($2.5 P), long-term incentive compensation related to the international integration ($0.2 P, $0.8 B, $1.2 C), and other ($0.1 C) 103.8 Diluted EPS 102.3 111.6 92.3 113.8 106.1 109.7 Income tax expense (benefit) Net income 1 104.8 Operating profit Adjusted Adjusted Cost of goods sold Gross profit Operating expenses GAAP Adjusted Adjusted GAAP Years Ended September 30, 2012 2011 2010 2009 |
|
|
35 Non-GAAP Operating Performance Measures ($ in millions) GAAP Adj Adjusted GAAP Adj Adjusted GAAP Adj Adjusted Cost of goods sold 194.6 $ (3.0) $ (a) 191.6 $ 261.9 $ (9.7) $ (e) 252.2 $ 456.5 $ (12.7) $ (h) 443.8 $ Gross profit 110.6 3.0 113.6 136.6 9.7 146.3 247.2 12.7 259.9 Operating expenses 86.5 (13.6) (b) 72.9 111.0 (15.2) (f) 95.8 197.5 (28.8) (i) 168.7 Operating profit 24.1 16.6 40.7 25.6 24.9 50.5 49.7 41.5 91.2 Interest expense 4.5 - 4.5 6.8 (0.6) (g) 6.2 11.3 (0.6) (j) 10.7 Other income (expense), net 0.9 (0.9) (c) - (0.3) - (0.3) 0.6 (0.9) (k) (0.3) Income tax expense 5.9 4.2 (d) 10.1 5.3 7.6 (d) 12.9 11.2 11.8 (d) 23.0 Net income 1 14.3 11.5 25.8 12.7 17.9 30.6 27.0 29.4 56.4 Diluted EPS 0.23 0.18 0.41 0.20 0.29 0.49 0.43 0.47 0.90 1 Net income attributable to Hillenbrand Three months ended March 31, 2013 Six months ended March 31, 2013 (i) Business acquisition costs ($0.3 P, $10.6 C), backlog amortization ($17.1 P), restructuring ($0.5 B, $0.2 C), antitrust litigation ($0.1 B) (j) Business acquisition costs ($0.6 C) P = Process Equipment Group; B = Batesville; C = Corporate Three months ended December 31, 2012 (k) Acquisition-related foreign currency transactions ($0.8 C), other ($0.1B) (e) Inventory step up ($8.1 P), restructuring ($0.1 P, $1.5 B) (f) Business acquisition costs ($0.3 P, $1.6 C), backlog amortization ($12.9 P), restructuring ($0.4 B) (g) Business acquisition costs ($0.6 C) (a) Inventory step up ($2.6 P), restructuring ($0.1 P, $0.3 B) (b) Business acquisition costs ($9.0 C), backlog amortization ($4.2 P), restructuring ($0.2 C), antitrust litigation ($0.1 B), other ($0.1 B) (c) Acquisition-related foreign currency transactions ($0.8 C), other ($0.1 B) (h) Inventory step up ($10.7 P), restructuring ($0.2 P, $1.8 B) (d) Tax effect of adjustments |
|
|
36 Cash Flow Information ($ in millions) Operating Activities 2012 2011 2010 2009 Net Income 104.8 $ 106.1 $ 92.3 $ 102.3 $ Depreciation and amortization 40.4 36.1 28.2 18.5 Interest income on Forethought Note - (6.4) (12.0) (12.4) Forethought Note interest payment - 59.7 10.0 - Change in working capital (19.8) (16.4) 16.9 6.5 Other, net 12.8 10.4 (17.2) 8.3 Net cash provided by operating activities (A) 138.2 $ 189.5 $ 118.2 $ 123.2 $ Capital expenditures (B) (20.9) (21.9) (16.3) (10.0) Forethought Note principal repayment - 91.5 - - Acquisition of businesses, net of cash acquired (4.4) (240.9) (371.5) - Proceeds from redemption and sales, and ARS and investments 0.8 12.4 37.2 2.3 Debt activity (162.3) 28.1 334.2 (40.0) Dividends (47.6) (46.9) (46.2) (45.6) Purchase of common stock - (3.8) - (12.5) Other 0.9 9.1 7.6 3.1 Net change in cash (95.3) $ 17.1 $ 63.2 $ 20.5 $ Free Cash Flow (A-B) 117.3 $ 167.6 $ 101.9 $ 113.2 $ Years Ended September 30, |
|
|
37 Q1 FY13 & Q1 FY12 - Cash Flow Information ($ in millions) Operating Activities 2012 2011 Net Income 14.6 $ 31.3 $ Depreciation and amortization 15.0 12.2 Change in working capital 12.9 (1.6) Other, net (22.8) (14.9) Net cash provided by operating activities (A) 19.7 $ 27.0 $ Capital expenditures (B) (5.6) (4.2) Acquisition of businesses, net of cash acquired (415.6) - Debt activity 494.8 - Dividends (12.1) (11.9) Other 0.7 (3.9) Net change in cash 81.9 $ 7.0 $ Free Cash Flow (A-B) 14.1 $ 22.8 $ Quarter Ended December 31, |
|
|
38 Q2 FY13 & Q2 FY12 - Cash Flow Information ($ in millions) Operating Activities 2013 2012 Net Income 13.2 $ 27.4 $ Depreciation and amortization 27.9 9.5 Change in working capital (11.1) (9.7) Other, net (30.0) 5.9 Net cash provided by operating activities (A) - $ 33.1 $ Capital expenditures (B) (5.6) (3.9) Acquisition of businesses, net of cash acquired - - Debt activity (46.1) (84.0) Dividends (12.2) (11.9) Other 2.5 4.3 Net change in cash (61.4) $ (62.4) $ Free Cash Flow (A-B) (5.6) $ 29.2 $ Quarter Ended March 31, |
|
|
39 YTD FY13 and FY12 - Cash Flow Information ($ in millions) Operating Activities 2013 2012 Net Income 27.8 $ 58.7 $ Depreciation and amortization 42.9 21.7 Change in working capital 1.8 (11.3) Other, net (52.8) (9.0) Net cash provided by operating activities (A) 19.7 $ 60.1 $ Capital expenditures (B) (11.2) (8.1) Acquisition of businesses, net of cash acquired (415.6) - Debt activity 448.7 (84.0) Dividends (24.3) (23.8) Other 3.2 0.4 Net change in cash 20.5 $ (55.4) $ Free Cash Flow (A-B) 8.5 $ 52.0 $ Six Months Ended March 31, |
|
|
Process Equipment Group’s strategy provides compelling growth opportunities and Coperion accelerates every dimension 40 K-Tron Rotex Terra Source Coperion $ Accelerated global expansion Improved access to underpenetrated geographies Expands ability to operate & grow globally Accelerated revenue growth PEG products in Coperion Systems Improves combined entity’s ability to succeed in penetrating large, growing end markets Enhanced system capabilities Access to new customers and selling channels Improved margins Lean business practices |