Exhibit 99.1
|
|
Hillenbrand Growth Continues |
Exhibit 99.1
|
|
Hillenbrand Growth Continues |
|
|
Throughout this presentation, we make a number of forward-looking statements within the meaning of the Private Securities Litigation Reform Act of 1995. As the words imply, forward-looking statements are statements about the future, as contrasted with historical information. Our forward-looking statements are based on assumptions and current expectations of future events that we believe are reasonable, but by their very nature they are subject to a wide range of risks. If our assumptions prove inaccurate or unknown risks and uncertainties materialize, actual results could vary materially from Hillenbrand’s expectations and projections. Words that could indicate we’re making forward-looking statements include the following: This is not an exhaustive list. Our intent is to provide examples of how readers might identify forward-looking statements. The absence of any of these words, however, does not mean that the statement is not forward-looking. Here’s the key point: Forward-looking statements are not guarantees of future performance, and our actual results could differ materially from those set forth in any forward-looking statements. Any number of factors — many of which are beyond our control — could cause our performance to differ significantly from what is described in the forward-looking statements. These factors include, but are not limited to: the outcome of any legal proceedings that may be instituted against Hillenbrand, Coperion or others following the acquisition; risks inherent in broader exposure to foreign markets; risks that the acquisition disrupts current operations or poses potential difficulties in employee retention or otherwise affects financial or operating results; the inability to recognize the benefits of the acquisition, including potential synergies and cost savings, or the failure of the acquired company to achieve its plans and objectives generally; and legislative, regulatory and economic developments. For a more in-depth discussion of these and other factors that could cause actual results to differ from those contained in forward-looking statements, see the discussions under the heading “Risk Factors” in item 1A of Hillenbrand’s Annual Report on Form 10-K for the year ended September 30, 2012, filed with the Securities and Exchange Commission (SEC) November 26, 2012. Hillenbrand assumes no obligation to update or revise any forward-looking information as a result of new information or future events or developments. Disclosure regarding forward-looking statements 2 |
|
|
Hillenbrand Participants Prepared Remarks Ken Camp – Hillenbrand President and CEO Guenter Bachmann – Coperion President Joe Raver – Hillenbrand Process Equipment Group President Cindy Lucchese – Hillenbrand CFO For more information contact: Chris Gordon – Hillenbrand Director Investor Relations Phone: (812) 931-5001 Email: chris.gordon@hillenbrand.com 3 |
|
|
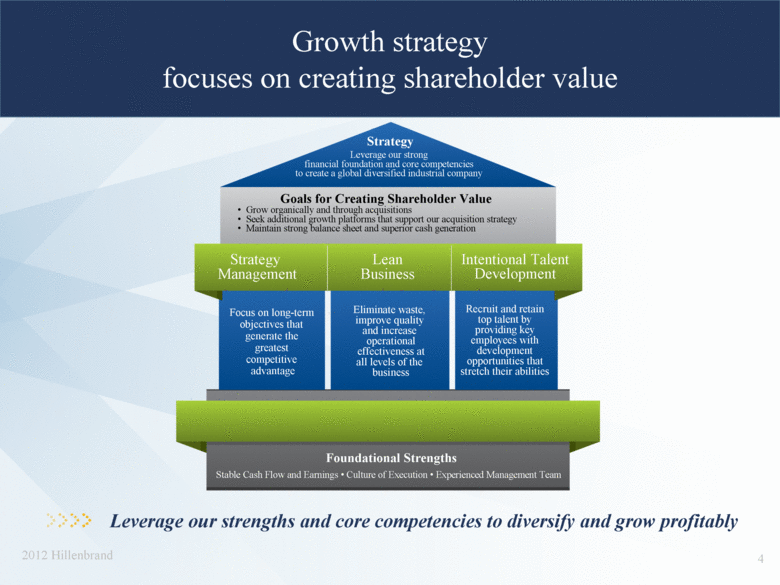
Growth strategy focuses on creating shareholder value 4 Leverage our strengths and core competencies to diversify and grow profitably Leverage our strong financial foundation and core competencies to create a global diversified industrial company Goals for Creating Shareholder Value • Grow organically and through acquisitions • Seek additional growth platforms that support our acquisition strategy • Maintain strong balance sheet and superior cash generation Strategy Management Lean Business Intentional Talent Development Focus on long-term objectives that generate the greatest competitive advantage Eliminate waste, improve quality and increase operational effectiveness at all levels of the business Recruit and retain top talent by providing key employees with development opportunities that stretch their abilities Stable Cash Flow and Earnings • Culture of Execution • Experienced Management Team |
|
|
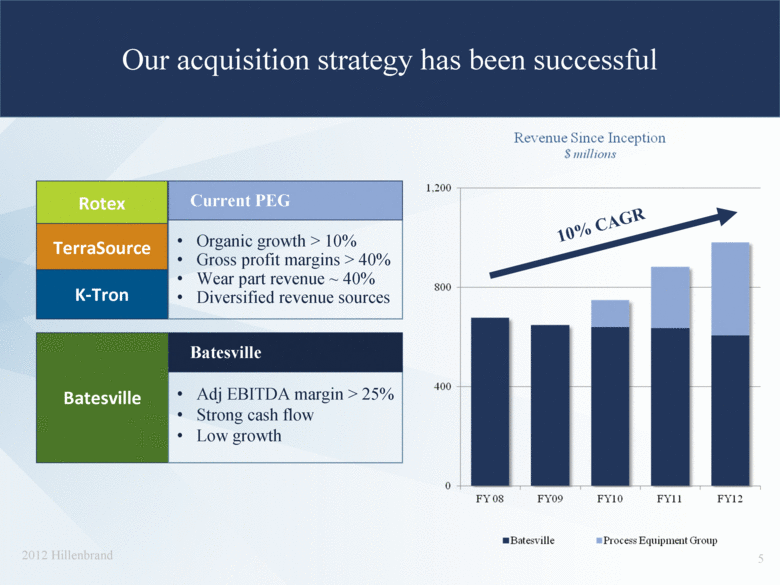
Our acquisition strategy has been successful 5 Rotex TerraSource K-Tron Organic growth > 10% Gross profit margins > 40% Wear part revenue ~ 40% Diversified revenue sources Current PEG Batesville Adj EBITDA margin > 25% Strong cash flow Low growth Batesville 10% CAGR |
|
|
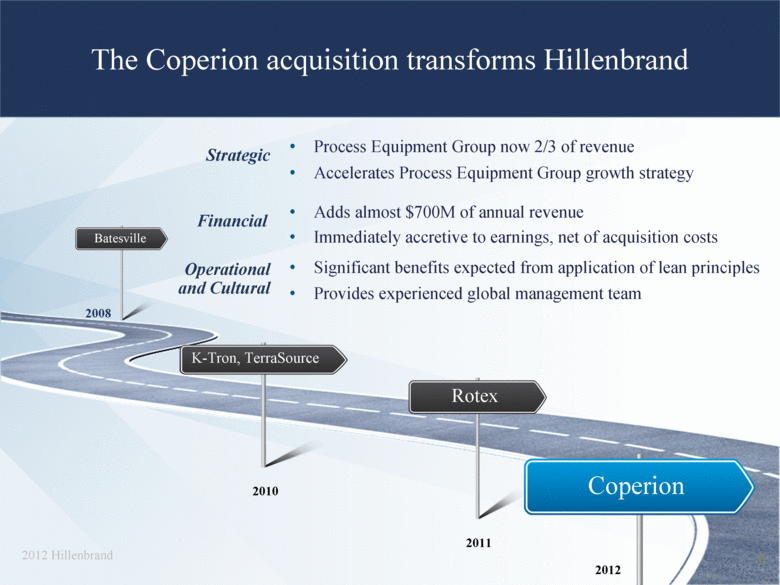
The Coperion acquisition transforms Hillenbrand 6 Strategic Process Equipment Group now 2/3 of revenue Accelerates Process Equipment Group growth strategy Financial Adds almost $700M of annual revenue Immediately accretive to earnings, net of acquisition costs Operational and Cultural Significant benefits expected from application of lean principles Provides experienced global management team Batesville 2008 K-Tron, TerraSource 2010 Rotex 2011 Coperion 2012 |
|
|
Hillenbrand Participants Prepared Remarks Ken Camp – Hillenbrand President and CEO Guenter Bachmann – Coperion President Joe Raver – Hillenbrand Process Equipment Group President Cindy Lucchese – Hillenbrand CFO 7 |
|
|
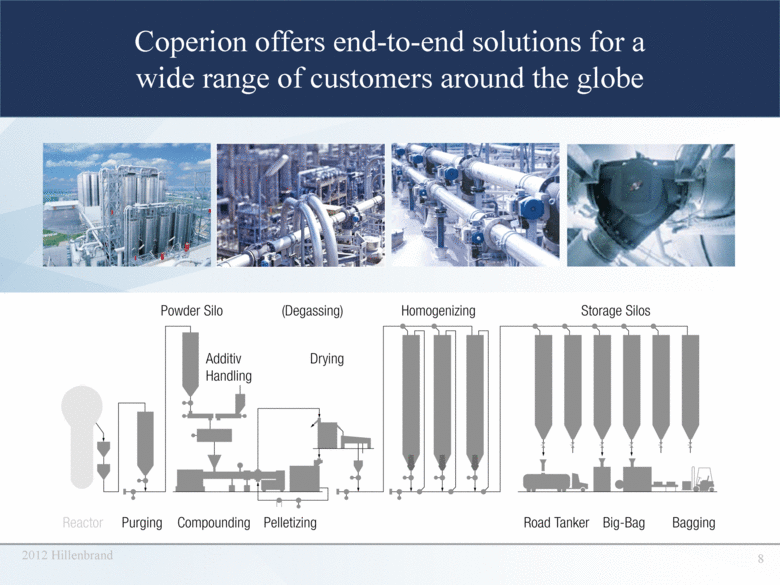
Coperion offers end-to-end solutions for a wide range of customers around the globe 8 |
|
|
9 Target Markets and Products Food Pharma Plastics Minerals Aluminum Chemicals Customized solutions are our response to complex challenges |
|
|
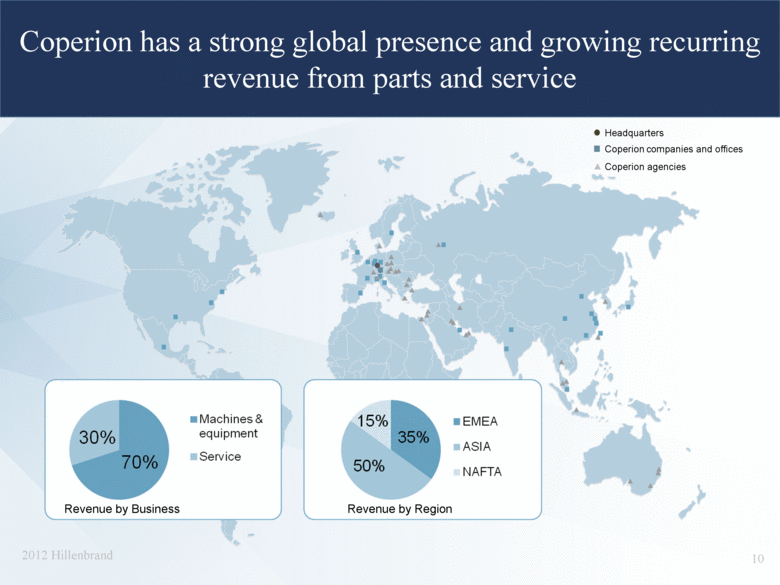
Coperion has a strong global presence and growing recurring revenue from parts and service 10 Headquarters Coperion companies and offices Coperion agencies Revenue by Region Revenue by Business |
|
|
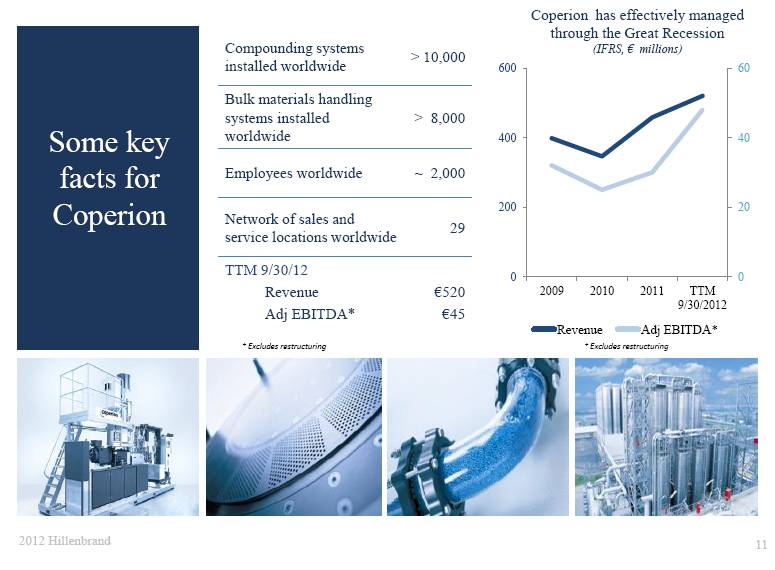
11 Compounding systems installed worldwide > 10,000 Bulk materials handling systems installed worldwide > 8,000 Employees worldwide ~ 2,000 Network of sales and service locations worldwide 29 TTM 9/30/12 Revenue Adj EBITDA* €520 €45 Some key facts for Coperion * Excludes restructuring * Excludes restructuring Coperion has effectively managed through the Great Recession (IFRS, € millions) |
|
|
Hillenbrand Participants Prepared Remarks Ken Camp – Hillenbrand President and CEO Guenter Bachmann – Coperion President Joe Raver – Hillenbrand Process Equipment Group President Cindy Lucchese – Hillenbrand CFO 12 |
|
|
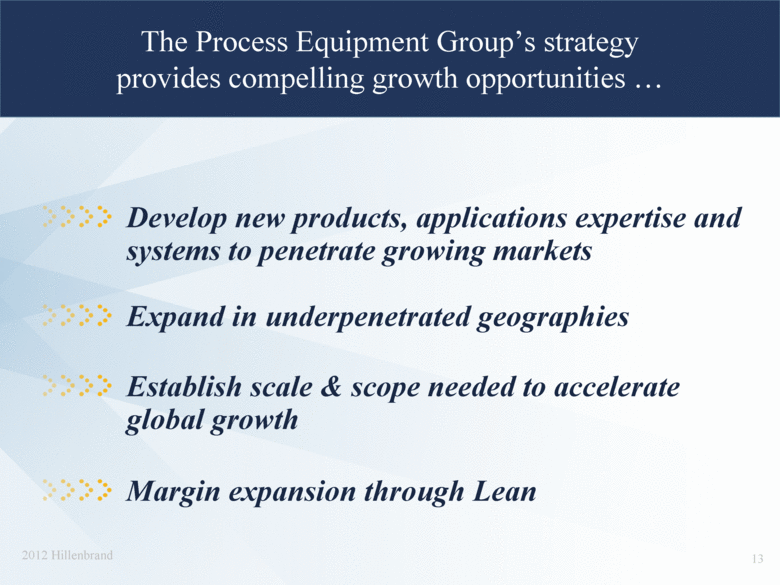
The Process Equipment Group’s strategy provides compelling growth opportunities 13 Develop new products, applications expertise and systems to penetrate growing markets Expand in underpenetrated geographies Establish scale & scope needed to accelerate global growth Margin expansion through Lean |
|
|
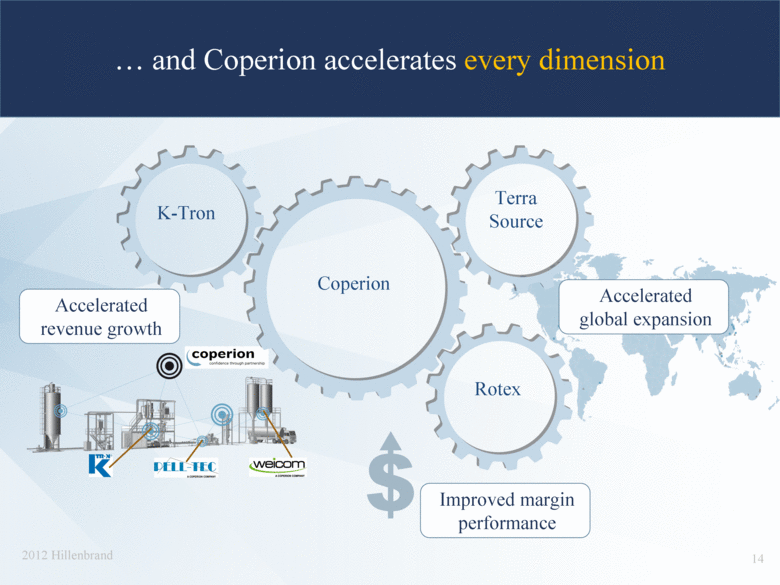
and Coperion accelerates every dimension 14 K-Tron Rotex Terra Source Coperion $ Improved margin performance Accelerated global expansion Accelerated revenue growth |
|
|
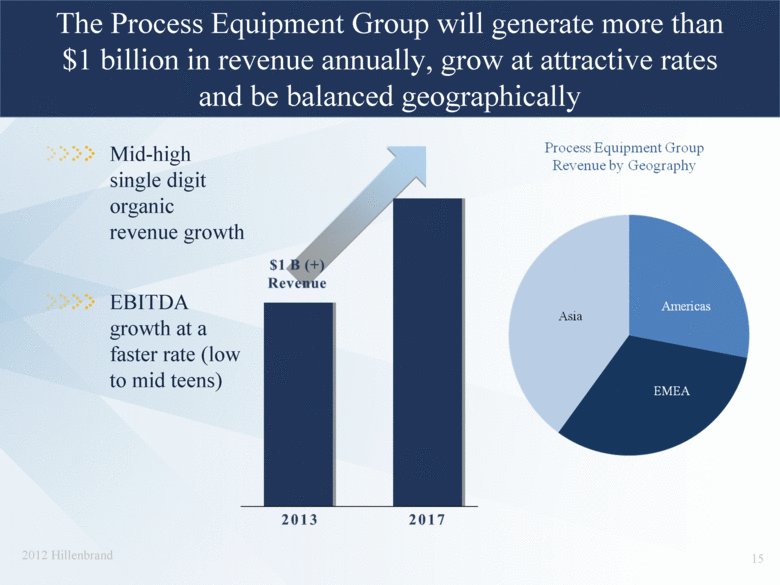
The Process Equipment Group will generate more than $1 billion in revenue annually, grow at attractive rates and be balanced geographically 15 Mid-high single digit organic revenue growth EBITDA growth at a faster rate (low to mid teens) |
|
|
Hillenbrand Participants Prepared Remarks Ken Camp – Hillenbrand President and CEO Guenter Bachmann – Coperion President Joe Raver – Hillenbrand Process Equipment Group President Cindy Lucchese – Hillenbrand CFO 16 |
|
|
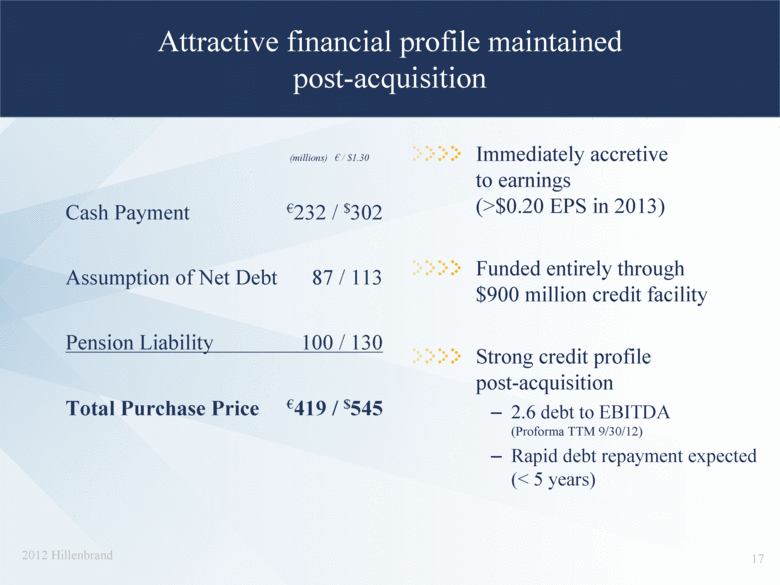
Attractive financial profile maintained post-acquisition 17 Immediately accretive to earnings (>$0.20 EPS in 2013) Funded entirely through $900 million credit facility Strong credit profile post-acquisition 2.6 debt to EBITDA (Proforma TTM 9/30/12) Rapid debt repayment expected (< 5 years) Cash Payment €232 / $302 Assumption of Net Debt 87 / 113 Pension Liability 100 / 130 Total Purchase Price €419 / $545 (millions) € / $1.30 |
|
|
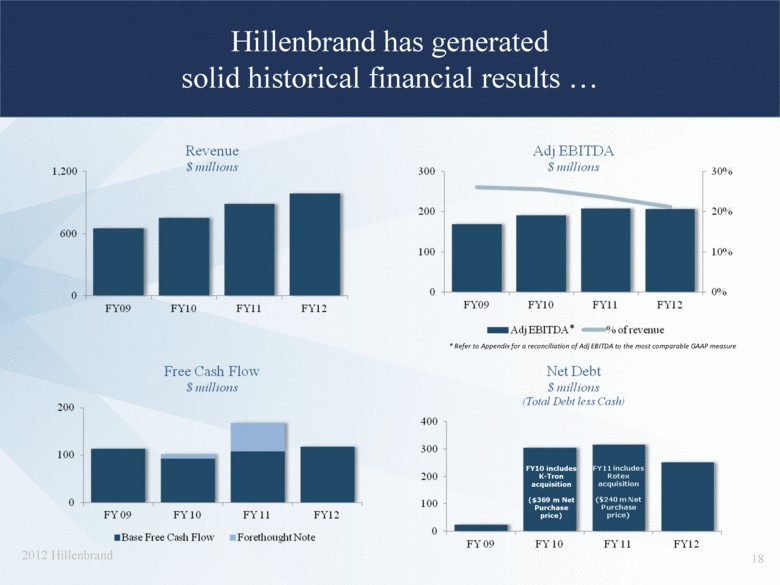
Hillenbrand has generated solid historical financial results 18 FY10 includes K-Tron acquisition ($369 m Net Purchase price) * * Refer to Appendix for a reconciliation of Adj EBITDA to the most comparable GAAP measure |
|
|
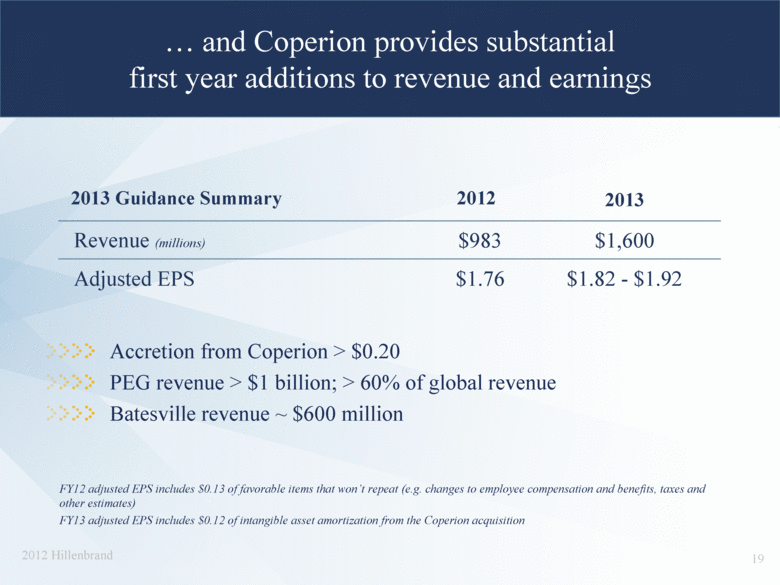
and Coperion provides substantial first year additions to revenue and earnings 19 Accretion from Coperion > $0.20 PEG revenue > $1 billion; > 60% of global revenue Batesville revenue ~ $600 million 2013 Guidance Summary 2012 2013 Revenue (millions) $983 $1,600 Adjusted EPS $1.76 $1.82 - $1.92 FY12 adjusted EPS includes $0.13 of favorable items that won’t repeat (e.g. changes to employee compensation and benefits, taxes and other estimates) FY13 adjusted EPS includes $0.12 of intangible asset amortization from the Coperion acquisition |
|
|
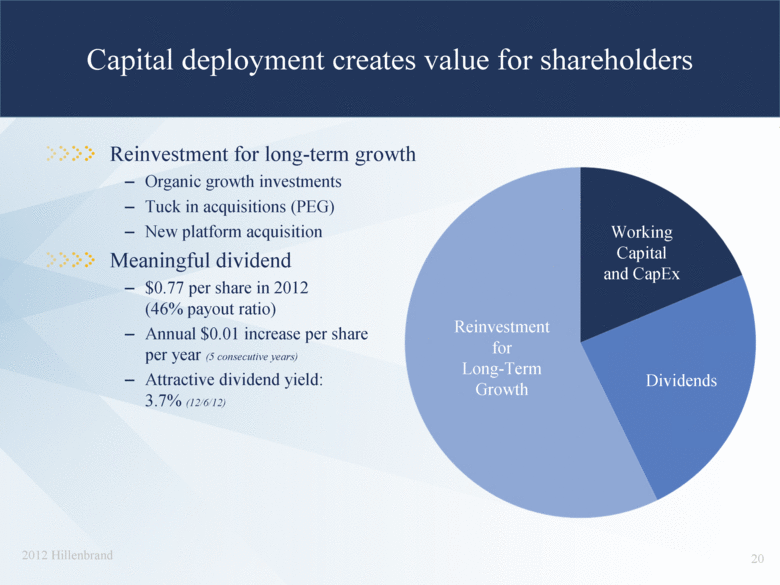
Capital deployment creates value for shareholders 20 Reinvestment for long-term growth Organic growth investments Tuck in acquisitions (PEG) New platform acquisition Meaningful dividend $0.77 per share in 2012 (46% payout ratio) Annual $0.01 increase per share per year (5 consecutive years) Attractive dividend yield: 3.7% (12/6/12) Reinvestment for Long-Term Growth Working Capital and CapEx Dividends |
|
|
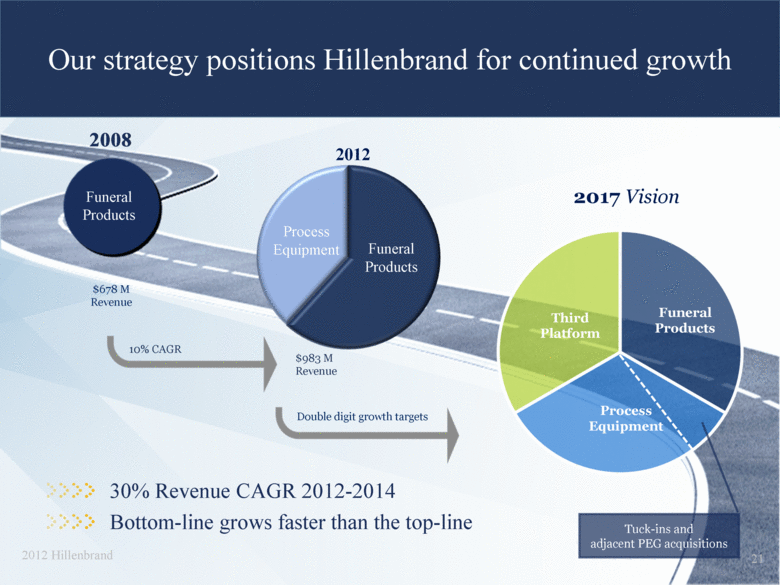
Our strategy positions Hillenbrand for continued growth 21 30% Revenue CAGR 2012-2014 Bottom-line grows faster than the top-line 2012 10% CAGR $983 M Revenue Double digit growth targets Funeral Products Funeral Products $678 M Revenue Funeral Products Process Equipment Third Platform 2017 Vision Funeral Products Tuck-ins and adjacent PEG acquisitions 2008 |
|
|
Questions? |
|
|
Appendix |
|
|
24 Disclosure regarding non-GAAP measures In addition to the financial measures prepared in accordance with accounting principles generally accepted in the U.S. (GAAP), this presentation also contains non-GAAP financial measures. These non-GAAP measures are not in accordance with, nor are they a substitute for, GAAP measures. Hillenbrand uses this information internally and believes it is helpful to investors because it allows more meaningful period-to-period comparisons of our ongoing operating results. The information can also be used to perform trend analysis and to better identify operating trends that may otherwise be masked or distorted by these types of items. Finally, the company believes these non-GAAP measures provide a higher degree of transparency to the company’s core operations. See Appendix for a reconciliation of non-GAAP measures to the most directly comparable GAAP measures. In providing 2013 adjusted diluted EPS guidance, there could be differences between expected GAAP diluted EPS and adjusted diluted EPS for matters including, but not limited to, inventory step-up, backlog amortization, and other costs related to the Coperion acquisition and transition. At this time, management is not able to estimate with precision the aggregate impact of these items on GAAP diluted EPS. Accordingly, a GAAP equivalent for adjusted diluted EPS guidance has not been provided. |
|
|
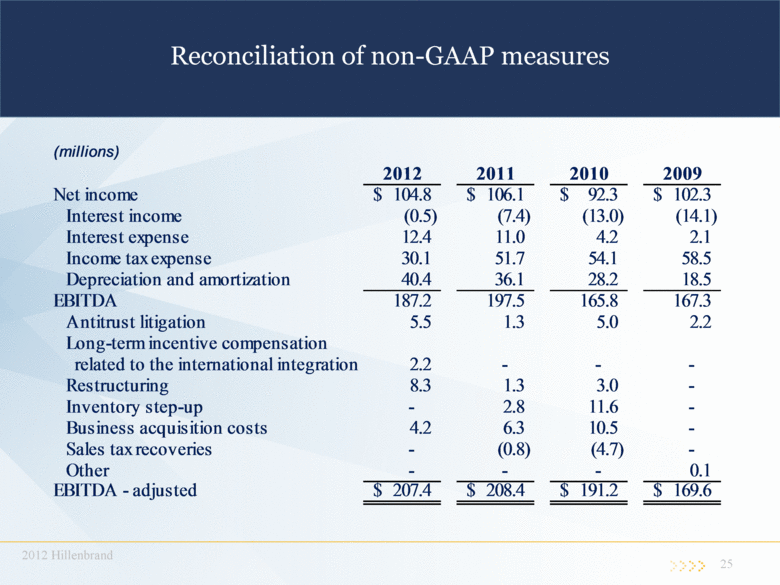
25 Reconciliation of non-GAAP measures (millions) 2012 2011 2010 2009 Net income 104.8 $ 106.1 $ 92.3 $ 102.3 $ Interest income (0.5) (7.4) (13.0) (14.1) Interest expense 12.4 11.0 4.2 2.1 Income tax expense 30.1 51.7 54.1 58.5 Depreciation and amortization 40.4 36.1 28.2 18.5 EBITDA 187.2 197.5 165.8 167.3 Antitrust litigation 5.5 1.3 5.0 2.2 Long-term incentive compensation related to the international integration 2.2 - - - Restructuring 8.3 1.3 3.0 - Inventory step-up - 2.8 11.6 - Business acquisition costs 4.2 6.3 10.5 - Sales tax recoveries - (0.8) (4.7) - Other - - - 0.1 EBITDA - adjusted 207.4 $ 208.4 $ 191.2 $ 169.6 $ |