Exhibit 99.1
|
|
Annual Shareholder Meeting February 22, 2012 |

Exhibit 99.1
|
|
Annual Shareholder Meeting February 22, 2012 |
|
|
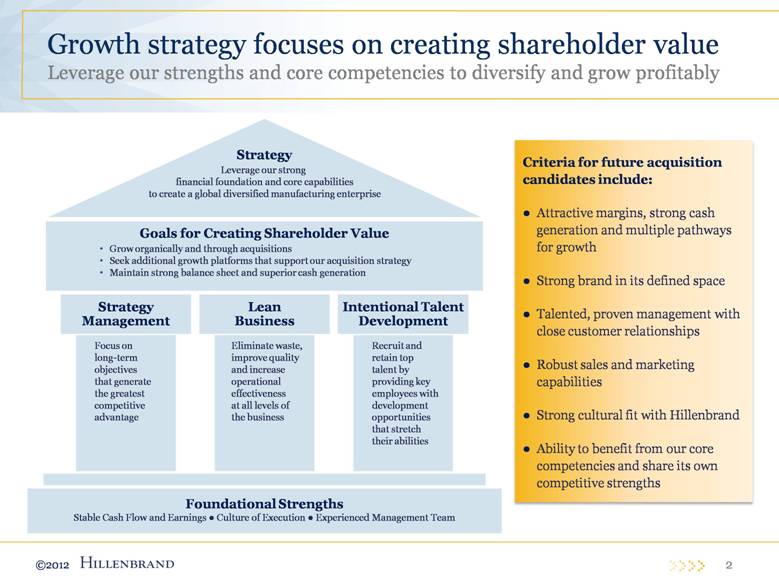
2 Growth strategy focuses on creating shareholder value Leverage our strengths and core competencies to diversify and grow profitably Leverage our strong financial foundation and core capabilities to create a global diversified manufacturing enterprise Goals for Creating Shareholder Value Grow organically and through acquisitions Seek additional growth platforms that support our acquisition strategy Maintain strong balance sheet and superior cash generation Foundational Strengths Stable Cash Flow and Earnings • Culture of Execution • Experienced Management Team Strategy Management Focus on long-term objectives that generate the greatest competitive advantage Lean Business Eliminate waste, improve quality and increase operational effectiveness at all levels of the business Intentional Talent Development Recruit and retain top talent by providing key employees with development opportunities that stretch their abilities Strategy Criteria for future acquisition candidates include: Attractive margins, strong cash generation and multiple pathways for growth Strong brand in its defined space Talented, proven management with close customer relationships Robust sales and marketing capabilities Strong cultural fit with Hillenbrand Ability to benefit from our core competencies and share its own competitive strengths |
|
|
3 Hillenbrand has grown significantly since 2008, and now operates on two separate platforms 2008 2010 2011 Hillenbrand, Inc. Hillenbrand begins operation as a public company on the Batesville foundational platform – April 1, 2008 K-Tron Hillenbrand acquires K-Tron International, Inc. (now part of the Process Equipment Group) – April 1, 2010 Rotex Hillenbrand acquires Rotex (also part of the Process Equipment Group) – August 31, 2011 $0 $400 $800 $1,200 FY 08 FY09 FY10 FY11 FY12 GUIDANCE MIDPOINT Revenue Since Inception Batesville Process Equipment Group 10.4% compounded annual growth rate |
|
|
4 Hillenbrand’s growth strategy has provided diversification both in location and products Hillenbrand Revenue Mix by Geography Hillenbrand Revenue Mix by Platform Domestic Asia-Pacific EMEA Other Americas 0% 20% 40% 60% 80% 100% FY 08 FY 09 FY 10 FY 11 FY 12 ESTIMATE Hillenbrand Revenue by Platform Funeral services products Process Equipment 0% 20% 40% 60% 80% 100% FY 08 FY 09 FY 10 FY 11 FY 12 ESTIMATE Hillenbrand Revenue by Geography Domestic International |
|
|
5 Our strategy is designed to continue growth both organically and through acquisitions Funeral Products Third Platform 2008 2011 2016 Vision Funeral Products Funeral Products $678.1 Net Revenue 9.2% CAGR $883.4 Net Revenue Double-digit growth targets Tuck-ins and adjacent PEG acquisitions process equipment |
|
|
6 The Process Equipment Group Strong growth potential both in industries and geographies History of 10% organic revenue growth Significant opportunities to expand into global growth markets Robust backlog levels Development of lean business skills to reduce costs, improve customer satisfaction and shorten lead times History of long-term customer relationships in key industries: plastics, minerals, food, etc. 80 70 60 50 40 30 20 10 0 PEG Backlog - 20 40 60 80 100 120 Q3 FY 10 Q4 FY 10 Q1 FY 11 Q2 FY 11 Q3 FY 11 Q4 FY 11 Peg Backlog $ in millions Backlog K - Tron/SRG Backlog Rotex 33.5% Com pounded Annual Growth Rate (Exluding Rotex) |
|
|
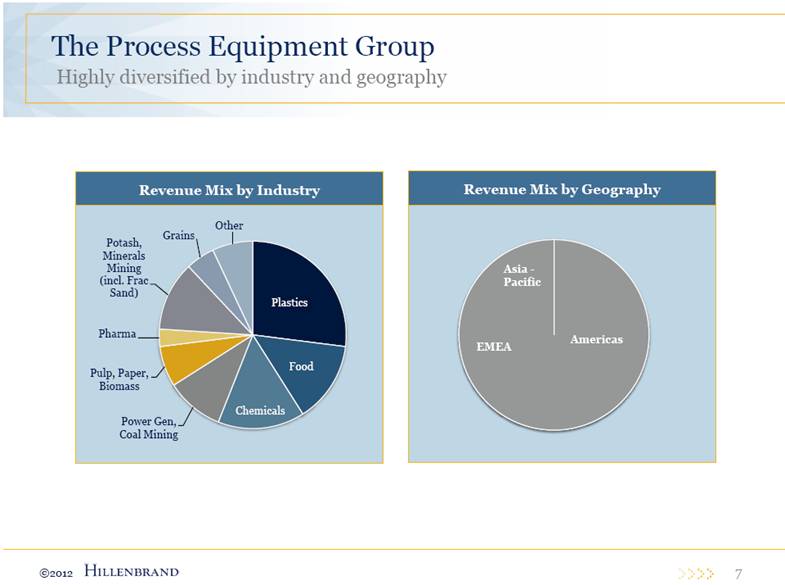
Revenue Mix by Geography Revenue Mix by Industry 7 The Process Equipment Group Highly diversified by industry and geography |
|
|
8 The Process Equipment Group Manufacturing world-class industrial processing equipment Leader in feeders, pneumatic conveying and systems solutions Crushers and biomass handling equipment Industrial screening and separating equipment Size Reduction Group |
|
|
9 Rotex Acquisition Sept. 1 Has an attractive business profile in a wide variety of industries and geographies Attractive markets, product categories and geographies Highly profitable, with strong organic growth and relatively low capital requirements Substantial recurring revenue stream from replacement parts business A diverse customer base both by geography and industry Revenue by Geography Revenue by Product Category Revenue by End Market Note: Revenue breakdown charts based on calendar 2010 financials |
|
|
10 Rotex Acquisition Sept. 1 A global company, Rotex has plans to extend its reach into new geographies Targeted Growth Areas ROTEX HQ Cincinnati, OH Runcorn, England Wavre, Belgium Independent Sales Reps Sales Offices Strategic Manufacturing Partners Licensee |
|
|
11 Batesville The largest segment of the funeral products industry Caskets Funeral Products ($2.6 Billion Industry) Caskets (Total Revenue $1.3 Billion) Batesville (Total 2011 Revenue: $638 Million) Other (100+) Batesville Importers Aurora Matthews Other, including Options, Batesville Interactive, Vaults and Northstar Caskets Market Leader Grave Markers Not in Market Cremation Market Leader Vaults New Entrant to Market |
|
|
12 Batesville market conditions Batesville continues to post steady results in an evolving industry Industry Dynamics Attractive Financials Deaths have been declining as healthcare improvements extend life expectancy Cremations are increasing at an upward trend of approximately 120-140 basis points per year As a result, demand for burial caskets has been declining slowly Competition has become more aggressive, especially on price Historically high return on invested capital (approximately 60%) Gross margins exceeding 40%; operating margins exceeding 25% We accomplish this by: Providing a broad portfolio of premium products Leveraging our high-velocity distribution system Focusing on lean business practices to improve the cost structure Operating Profit and Margins Estimated Deaths (Millions) |
|
|
Financial Overview 13 |
|
|
14 Hillenbrand 2011 results Net revenue up 18%; Adj. EBITDA up 9%; EPS up 2%; The Process Equipment Group grew year-over-year organic revenue by 25% (18% net of fx) Completion of Rotex acquisition added one month of sales to already strong PEG results Acquisition-related costs affected EBITDA, EPS and cash flow Collection of the Forethought Note was a primary driver in year-over-year increase in cash flow from operations FY11 results exceeded guidance at both revenue and bottom-line performance FISCAL YEAR ENDED SEPTEMBER 30 $ IN MILLIONS (except EPS) 2011 2010 2011 Guidance Net Revenue % Y/Y Growth $883.4 17.9% $749.2 15.4% $855 - $875 EBITDA (Adjusted) % of Revenue $208.4 23.6% $191.2 25.5% EPS (GAAP) $1.71 $1.49 $1.69-$1.75 EPS (Adjusted) $1.84 $1.80 $1.72 - $1.78 Cash Flows from Operations $189.5 $118.2 See the 10-K for reconciliation between GAAP and adjusted balances for the years ended October 31, 2011 and 2010, respectively. |
|
|
FIRST QUARTER ENDED DECEMBER 31 $ IN MILLIONS (except EPS) Q1 2012 Q1 2011 Net Revenue % Y/Y Growth $232 10% $211 30% EBITDA (Adjusted) % of Revenue $48 21% $51 24% EPS (GAAP) $.50 $.44 EPS (Adjusted) $0.40 $0.44 Cash Flows from Operations $27 $28 15 Hillenbrand Q1 2012 Net revenue up 10%; Process Equipment Group up 68% (37% of total revenue) Top- and bottom-line results were strengthened as a result of our acquisition strategy to diversify holdings The Process Equipment Group grew year-over-year revenue by 68%, delivering 20% organic revenue growth Order backlog for the Process Equipment Group continued to grow sequentially, ending the quarter at $129 million – 8% higher than Q4 2011 Batesville cash generation remained consistent despite soft demand in the quarter that led to a 9% drop in Batesville revenue Hillenbrand realized a $10 million tax benefit as the result of permanently reinvesting certain international earnings overseas See the 10-Q for reconciliation between GAAP and adjusted balances for the quarters ended December 31, 2011 and 2010, respectively. |
|
|
16 Hillenbrand capital deployment Focus is on creating shareholder value Meaningful dividend Annual dividend in 2011 was $.76 per share, which was equivalent to a 44% payout ratio (41% adjusted) Increased dividend in December to $.77 per share Attractive current dividend yield: 3.25% (2/17/12) Reinvestment for long-term growth Invest to support organic growth Acquire quality businesses with growth potential in the Process Equipment Group space Acquire new platform Working Capital and CapEx Dividends Reinvestment for Long-Term Growth |
|
|
17 Shareholder value Our responsibility is to be effective stewards of your investment Our Strategy Build a strong, diversified organization that supports growth-oriented operating companies to drive accelerated increases in shareholder value. We’ll provide effective governance and leverage results through these core competencies: Strategy management process Lean business practices Intentional talent development Stock Performance Hillenbrand vs. S&P 500 Index and S&P 600 Sm Cap Index * Includes dividend reinvestment Our stock outperformed the SP 500 and S&P 600 indices during a highly volatile period (2011 – present) We have increased our dividend by 1¢ per share for each year of our existence (4 consecutive years) Our current dividend yield is 3.25% (2/17/2012) |
|
|
18 Hillenbrand is an attractive investment opportunity Cash Generation Growth Opportunity Strong Dividend The Process Equipment Group provides significant global growth opportunities and diversification Growth is enhanced by leveraging our core competencies Further acquisitions will provide additional profitable growth and diversification Both Batesville and the Process Equipment Group are market leaders and proven cash generators Strong balance sheet and stable cash flow support the Hillenbrand growth strategy Meaningful return of cash to shareholders, including an attractive dividend yield Annual dividend increases since HI inception (2008) History and Culture of Execution Proven, results-oriented management teams with operational, public company and acquisition expertise Strong core competencies in lean business Long track record of increasing revenues and carefully managing expenses |
|
|
Questions |
|
|
Annual Shareholder Meeting February 22, 2012 |