Exhibit 99.1
|
|
Creating Shareholder Value |
Exhibit 99.1
|
|
Creating Shareholder Value |
|
|
Disclosure regarding forward-looking statements Throughout this presentation, we make a number of forward-looking statements within the meaning of the Private Securities Litigation Reform Act of 1995. As the words imply, forward-looking statements are statements about the future, as contrasted with historical information. Our forward-looking statements are based on assumptions and current expectations of future events that we believe are reasonable, but by their very nature they are subject to a wide range of risks. If our assumptions prove inaccurate or unknown risks and uncertainties materialize, actual results could vary materially from Hillenbrand’s expectations and projections. Words that could indicate we’re making forward-looking statements include the following: This isn’t an exhaustive list, but is simply intended to give you an idea of how we try to identify forward-looking statements. The absence of any of these words, however, does not mean that the statement is not forward-looking. Here’s the key point: Forward-looking statements are not guarantees of future performance, and our actual results could differ materially from those set forth in any forward-looking statements. Any number of factors — many of which are beyond our control — could cause our performance to differ significantly from what is described in the forward-looking statements. These factors include, but are not limited to: recent global market and economic conditions, including those related to the credit markets; volatility of our investment portfolio; foreign currency fluctuations; ongoing involvement in claims, lawsuits and governmental proceedings related to operations; labor disruptions; our ability to continue the successful integration of K-Tron International; the dependence of our business units on relationships with several large national providers; increased costs or unavailability of raw materials; continued fluctuations in mortality rates and increased cremations; competition from nontraditional sources in the funeral services business; our ongoing antitrust litigation; cyclical demand for industrial capital goods; and certain tax-related matters. For a more in-depth discussion of these and other factors that could cause actual results to differ from those contained in forward-looking statements, see the discussions under the heading “Risk Factors” in item 1A of Hillenbrand’s Annual Report on Form 10-K for the year ended September 30, 2010, filed with the Securities and Exchange Commission (SEC) November 23, 2010. The company assumes no obligation to update or revise any forward-looking information. intend believe plan expect may goal would become pursue estimate will forecast continue could targeted encourage promise improve progress potential should |
|
|
Agenda Hillenbrand Profile Batesville Overview K-Tron Overview Financial Results |
|
|
Hillenbrand Profile |
|
|
Why invest in Hillenbrand now? Proven, results-oriented management team with operational, public company and acquisition experience Strong core competencies in lean business, evidenced by a history of continuous improvement Long track record of increasing revenues, maintaining high margins and generating substantial cash flow Strong balance sheet, steady profitable growth and reliable, robust cash flow Three industry-leading business platforms with attractive margins, solid bottom-line results and multiple runways for growth K-Tron complements Batesville’s predictable business and cash generation capabilities by providing diversification and significant growth opportunities Balance sheet strength and robust cash flow allow us to leverage core competencies for growth through acquisitions Acquisition strategy that emphasizes diversification and continued profitable growth Meaningful return of cash to shareholders, including above-average dividend payout ratio Strong Core Businesses History and Culture of Execution Strategy Focused on Increasing Shareholder Value |
|
|
Who is Hillenbrand? Founded in 1964, K-Tron International is a leading global provider of bulk solids material handling equipment and systems for a wide variety of manufacturing and other industrial processes Serves customers through two business lines: Process Group – Feeding and pneumatic conveying equipment, parts and services Size Reduction Group – Size reduction equipment, conveying systems and screening equipment, parts and services Founded in 1906 and dedicated for more than 100 years to helping families honor the lives of those they love® Provides the highest quality burial and cremation products to funeral directors and their client families North American leader in funeral products due to a history of manufacturing excellence, product innovation, superior customer service, and reliable delivery 2007 2008 2009 2010 Hillenbrand Industries announces a plan for the separation of Hill-Rom and Batesville Casket into two independent publicly traded companies Hillenbrand, Inc. (parent of Batesville Casket Company) began operation as a public company traded on the New York Stock Exchange April 1, 2008 Hillenbrand, Inc. completes acquisition of K-Tron April 1, 2010 Batesville K-Tron (Hillenbrand Industries) |
|
|
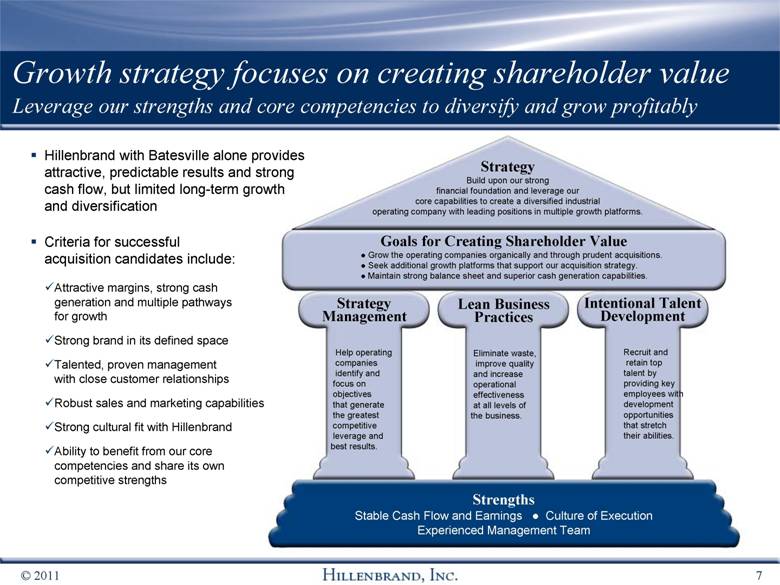
Growth strategy focuses on creating shareholder value Leverage our strengths and core competencies to diversify and grow profitably Strategy Build upon our strong financial foundation and leverage our core capabilities to create a diversified industrial operating company with leading positions in multiple growth platforms. Goals for Creating Shareholder Value • Grow the operating companies organically and through prudent acquisitions. • Seek additional growth platforms that support our acquisition strategy. • Maintain strong balance sheet and superior cash generation capabilities. Strengths Stable Cash Flow and Earnings • Culture of Execution Experienced Management Team Strategy Management Help operating companies identify and focus on objectives that generate the greatest competitive leverage and best results. Lean Business Practices Eliminate waste, improve quality and increase operational effectiveness at all levels of the business. Intentional Talent Development Recruit and retain top talent by providing key employees with development opportunities that stretch their abilities. Hillenbrand with Batesville alone provides attractive, predictable results and strong cash flow, but limited long-term growth and diversification Criteria for successful acquisition candidates include: Attractive margins, strong cash generation and multiple pathways for growth Strong brand in its defined space Talented, proven management with close customer relationships Robust sales and marketing capabilities Strong cultural fit with Hillenbrand Ability to benefit from our core competencies and share its own competitive strengths |
|
|
We have diversified our key segments and end markets Revenue By Segment* K-Tron 23% Historical Hillenbrand 77% * Represents FY2010 ended 9/30/10 for Historical Hillenbrand and last twelve months ended 9/30/10 for K-Tron ** Please see appendix for reconciliation between GAAP and Adjusted EBITDA for FY2010 ended 9/30/10 Historical Hillenbrand’s end markets include caskets and other death care products K-Tron’s end markets include: plastics compounding and base resin manufacturing; food processing; pharmaceutical and chemical; coal and minerals mining; coal-fired power generation; pulp, paper and forest products processing; biomass energy generation Historical Hillenbrand 81% K-Tron 19% Adjusted EBITDA by Segment ** |
|
|
Batesville Overview |
|
|
Batesville market conditions We continue to post steady results in an evolving industry Industry felt pressures in pricing, volume, mix and excess capacity Aggressive sales tactics, especially in the lower tiers, have become more common Batesville has maintained stable average selling price through successful sales programs, growth strategies and operational efficiencies across the supply chain Deaths relatively flat in fiscal 2010 and so far in 2011 Cremation rates returned to more typical increases of 110-120 basis points in 2010, but appear to be increasing at an average of 120-140 bp in 2011 Burial demand continues its slow decline in the near term Commodity prices, particularly for steel and fuel, are volatile – fairly stable in 2010, but rising in 2011 Leveraging high-velocity distribution system and continuing to drive lean business practices to improve the cost structure has allowed us to maintain attractive margins Burial Demand Industry Dynamics Cost Components |
|
|
Batesville is the largest player in the largest segment of the death care industry Funeral Products ($2.6 Billion Industry) Caskets (Total Revenue $1.3 Billion) Batesville Casket (Total 2010 Revenue: $640 Million) Caskets $1.3 Grave Markers $0.5 Cremation $0.3 Source: Company estimates and public filings for FY2010 Vaults $0.5 Caskets 89% Other (100+) Options 6% NorthStar 1% Batesville Importers Aurora Matthews Other 4% |
|
|
Batesville Casket commands a premium as the industry’s most respected brand World’s Largest Casket Manufacturer Iconic brand with 100+ years of history Industry leader: volume, revenue, margin share Superior mix of products Brand of choice for funeral directors’ families Unparalleled Commitment Top-quality product manufacturer Exceptional service provider Innovation leader Highly valued business partner Caskets, Cremation Products, Vaults, Websites Brands Sample Products Product Lines |
|
|
Batesville focuses on 3 key strategies Optimize the casket business, capitalize on growth opportunities, improve margin Optimize the Profitable Casket Business Endura Burial Vaults New Product Development Merchandising/Sales Batesville Interactive Options Cremation Products Operational excellence Lean manufacturing Continuous improvement in all business processes Improve Margin Capitalize on Growth Opportunities |
|
|
K-Tron Overview |
|
|
K-Tron acquisition New business represents strong growth potential History of >20 percent revenue growth (2003-2008), half organic and half through acquisition Strong, consistent gross profit margins, operating margins and cash flow Highly diversified customers, geographies and end markets Global presence Proven management team Ability to benefit from our core competencies Similar culture with Batesville Provides multiple growth opportunities and diversification We are more pleased with this acquisition today than on April 1 First priority was to ensure we had effective financial processes to support controls and yield timely and accurate financial reporting K-Tron is experiencing its first full cycle of the strategy management process and is applying that knowledge across the organization Lean business processes are beginning to take root Already seeing results of talent development programs Why K-Tron? Transition Update |
|
|
Process Group Overview Global leader in feeding and conveying equipment and components Process Group Feeding and Conveying Equipment and Components Leader in providing single-source bulk solids material handling solutions and technology Deep institutional knowledge of the science of bulk solids material and their properties Accurate feeding of “hard-to-handle” materials into a wide variety of manufacturing processes Conveys bulk solids through customized pneumatic conveying equipment and systems Original equipment typically 70-75 percent of sales; parts and services 25-30 percent Brands Sample Products Product Lines |
|
|
The Process Group is diversified by both industry and geography EMEA – Europe, Middle East and Africa Plastics Compounding and Base Resin Manufacturing 57% Food Manufacturing 18% Chemical 6% Pharmaceutical 6% Detergent and other Industries 13% U.S. and Canada 42% EMEA 31% China 12% Rest of Asia 12% 2010 Equipment Bookings Latin America 3% By Industry By Geography e |
|
|
Process Group growth potential Well-positioned to take advantage of new markets and technologies New product development, with focus on faster time to market Growing opportunities in Chinese domestic plastics compounding industry Economic recovery in emerging Eastern Europe and Russia markets Expansion of K-Tron Premier into EMEA/Asia through existing distribution network Acquisitions of leading brands that complement current product lines Single-source integrated material handling systems solutions K-Tron Feeder blending before packaging |
|
|
Process Group growth potential Organic growth opportunities exist by focusing on system integration Suppliers: Material Handling System Example |
|
|
Industry leaders providing the power generation, mining and forest products industries with crushers and other material handling equipment Brands with decades of industry experience and long-term customer retention More than 60 percent of revenue generated from the sale of highly profitable replacement parts Broad market coverage with minimal market overlap between companies Brands Sample Products Product Lines Size Reduction Group Size Reduction Components and Equipment Size Reduction Group Leader in equipment for power generation, mining, wood processing |
|
|
The Size Reduction Group is diversified and generates substantial revenue from profitable replacement parts U.S. Canada Latin America Europe China Rest of Asia Pulp, Paper and Forest Products / Biomass Chemicals, Plastics and Refining Other Power Generation Coal Mining By Geography By Industry Typical Equipment and Parts Bookings Potash and Other Non-Metallic Minerals Mining |
|
|
Size Reduction Group growth potential Poised for significant growth on a global scale China and India coal power and coal mining markets continue to expand dramatically Growth in mineral mining for food production Worldwide interest in biomass energy projects continues to grow Economic recovery will increase power demand and parts sales Improving pulp prices are providing a rebound for capital equipment and replacement parts Businesses with complementary product lines or access to other niche markets represent acquisition opportunities PCC Reversible Hammermill |
|
|
Financial Overview |
|
|
Hillenbrand 2Q2011 Financials Overall results in line with expectations; Batesville, K-Tron post solid performance QUARTER ENDED MARCH 31 2011 2010 $ IN MILLIONS (except EPS) Net Revenue % Y/Y Growth $230 35.3% $170 (0.6%) Gross Profit % of Revenues $102 44.3% $77 45.3% Operating Expenses (Adjusted) * % of Revenue $53 23.0% $34 20.0% EBITDA (Adjusted) * % of Revenue $60 26.1% $49 28.8% Net Income (Adjusted) * $34 $30 EPS (Adjusted) * $0.54 $0.49 Cash Flows from Operations $25 $53 Batesville and K-Tron continue to provide steady cash flow and profitability Batesville’s 2Q revenue increased 1.4 percent, with U.S. and Canadian burials down slightly K-Tron increased revenue by 52 percent compared to prior year and backlog by 17 percent compared to Q1 2011 Adjusted EBITDA increased 22 percent Cash flow decline mostly related to timing of income tax and vendor payments in FY2010 * Please see appendix for reconciliation between GAAP and adjusted balances for the quarters ended March 31, 2011 and 2010 |
|
|
Shareholder value Our responsibility is to be effective stewards of your investment Our stock continues to outperform the S&P 500 and S&P 600 indices For the third consecutive year, we increased our annual dividend in December by 1¢ per share Our current dividend yield is ~3.5 percent Our Strategy Build a strong, diversified organization that supports growth-oriented operating companies to drive accelerated increases in shareholder value. We’ll provide effective governance and leverage results through these core competencies: Strategy management process Lean business practices Intentional talent development |
|
|
Why invest in Hillenbrand now? Proven, results-oriented management team with operational, public company and acquisition experience Strong core competencies in lean business, evidenced by a history of continuous improvement Long track record of increasing revenues, maintaining high margins and generating substantial cash flow Strong balance sheet, steady profitable growth and reliable, robust cash flow Three industry-leading business platforms with attractive margins, solid bottom-line results and multiple runways for growth K-Tron complements Batesville’s predictable business and cash generation capabilities by providing diversification and significant growth opportunities Balance sheet strength and robust cash flow allow us to leverage core competencies for growth through acquisitions Acquisition strategy that emphasizes diversification and continued profitable growth Meaningful return of cash to shareholders, including above-average dividend payout ratio Strong Core Businesses History and Culture of Execution Strategy Focused on Increasing Shareholder Value |
|
|
Questions? |
|
|
Appendix |
|
|
Hillenbrand 2010 Financials Net revenue up 15%; Adj. net income up 8%; Adj. EPS up 7%; Adj. EBITDA up 12.4% FISCAL YEAR ENDED SEPTEMBER 30 2010 2009 $ IN MILLIONS (except EPS) Net Revenue % Y/Y Growth $749 15.4% $649 (4.3%) Gross Profit (Adjusted) * % of Revenue $325 43.4% $274 42.2% Operating Expenses (Adjusted) * % of Revenue $160 21.4% $117 18.0% EBITDA (Adjusted) * % of Revenue $191 25.5% $170 26.2% Net Income (Adjusted) * $112 $104 EPS (Adjusted) * $1.80 $1.68 Cash Flows from Operations $118 $123 K-Tron acquisition April 1 drove increases in revenue, gross profit and EBITDA Acquisition-related costs affected operating expenses, net income, EPS and cash flow Issued 10-year, $150 million public notes in July at 5.5 percent coupon rate. Batesville maintained solid earnings and stable cash flow. K-Tron recorded strong sales and increased backlog in six months with Hillenbrand. * Please see appendix for reconciliation between GAAP and adjusted balances for the years ended September 30, 2010 and 2009 |
|
|
Disclosure regarding non-GAAP measures While Hillenbrand, Inc. reports financial results in accordance with accounting principles generally accepted in the United States (GAAP), this presentation includes non-GAAP measures. These non-GAAP measures are not in accordance with, nor are they a substitute for, GAAP measures. Hillenbrand uses the non-GAAP measures to evaluate and manage its operations and provides the information to investors so they can see the results "through the eyes" of management. Hillenbrand further believes that providing this information better enables investors to understand the ongoing operating performance of the company. Investors should consider non-GAAP measures in addition to, not as a substitute for, or as superior to, measures of financial performance prepared in accordance with GAAP. |
|
|
Hillenbrand financials 2Q2011 GAAP net income to adjusted EBITDA reconciliation (unaudited) ( amounts in millions) * Management believes that earnings before interest, taxes, depreciation and amortization (EBITDA) is a useful measure for providing additional insight into the company’s operating performance. Three Months Ended March 31, 2011 20 10 GAAP net income $ 33.0 $ 29.4 Interest income (3. 1 ) (3. 1 ) Interest expense 2. 9 0. 3 Income tax expense 17.5 16.9 Depreciation and amortization 8. 6 4.5 EBITDA 58.9 48.0 Certain non-operating costs: Antitrust litigation 0.3 0.3 Business acquisition 1.0 1.0 Sales tax adjustment (0. 1 ) — Adjusted EBITDA $ 60.1 $ 49.3 |
|
|
Hillenbrand financials 2010 GAAP net income to adjusted EBITDA reconciliation (unaudited) (amounts in millions) * Management believes that earnings before interest, taxes, depreciation and amortization (EBITDA) is a useful measure for providing additional insight into the company’s operating performance. Fiscal Year Ending Sept. 30 , 2010 2009 GAAP net income $ 92.3 $ 102.3 Interest income ( 13.0 ) ( 14.1 ) Interest expense 4.2 2.1 Income tax expense 54.1 58.5 Depreciation and amortization 28.2 18.5 EBITDA 165.8 167.3 Certain non - operating costs: Antitrust litigation 5.0 2.2 Acquisition accounting 13.3 — Acquisition costs 10.5 — Sales tax adjustment (4.7 ) — Airport restructuring 3.0 — Separation costs — 0.1 Depreciation and amortization included in acquisition acctg. ( 1.7 ) — Adjusted EBITDA $ 191.2 $ 169.6 |
|
|
Hillenbrand financials 2Q2011 GAAP net income to adjusted net income reconciliation (unaudited) Three Months Ended Three Months Ended March 31, 2011 March 31, 2010 Pre- Tax Income Taxes Post- Tax Pre- Tax Income Taxes Post- Tax GAAP net income $ 50.5 $ 17.5 $ 33.0 $ 46.3 $ 16.9 $ 29.4 Certain non-operating costs: Antitrust litigation 0.3 0.1 0.2 0.3 0.1 0.2 Business acquisition 1.0 0.3 0.7 1.0 0.4 0.6 Sales tax adjustment (0.1) — (0.1) — — — Adjusted net income $ 51.7 $ 17.9 $ 33.8 $ 47.6 $ 17.4 $ 30.2 Adjusted diluted earnings per share $ 0.54 $ 0.49 (amounts in millions, except per share data) |
|
|
Hillenbrand financials 2010 GAAP net income to adjusted net income reconciliation (unaudited) (amounts in millions, except per share data) Fiscal Year Ended September 30, 2009 2010 Pre- Tax Income Taxes Post- Tax Pre- Tax Income Taxes Post- Tax GAAP net income $ 160.8 $ 58.5 $ 102.3 $ 146.4 $ 54.1 $ 92.3 Certain non-operating costs: Antitrust litigation 2.2 0.8 1.4 5.0 1.8 3.2 Non-recurring effects of acquisition accounting ─ ─ ─ 13.3 4.8 8.5 Business acquisition costs ─ ─ ─ 10.5 1.8 8.7 Sales tax adjustment ─ ─ ─ (4.7) (1.7) (3.0) Restructuring costs 3.0 1.1 1.9 Separation costs 0.1 ─ 0.1 ─ ─ ─ Adjusted net income $ 163.1 $ 59.3 $ 103.8 $ 173.5 $ 61.9 $ 111.6 Adjusted diluted earnings per share $ 1.68 $ 1.80 |